Immigrants from St. Vincent and the Grenadines vs Croatian Births to Unmarried Women

COMPARE

Immigrants from St. Vincent and the Grenadines
Race
Ancestry
AfghanAfricanAlaska NativeAlaskan AthabascanAlbanianAleutAlsatianAmericanApacheArabArapahoArgentineanArmenianAssyrian/Chaldean/SyriacAustralianAustrianBahamianBangladeshiBarbadianBasqueBelgianBelizeanBermudanBhutaneseBlackfeetBolivianBrazilianBritishBritish West IndianBulgarianBurmeseCajunCambodianCanadianCape VerdeanCarpatho RusynCelticCentral AmericanCentral American IndianCherokeeCheyenneChickasawChileanChineseChippewaChoctawColombianColvilleComancheCosta RicanCreeCreekCrowCubanCypriotCzechCzechoslovakianDanishDelawareDominicanDutchDutch West IndianEastern EuropeanEcuadorianEgyptianEnglishEstonianEthiopianEuropeanFijianFilipinoFinnishFrenchFrench American IndianFrench CanadianGermanGerman RussianGhanaianGreekGuamanian/ChamorroGuatemalanGuyaneseHaitianHmongHonduranHopiHoumaHungarianIcelanderIndian (Asian)IndonesianInupiatIranianIraqiIrishIroquoisIsraeliItalianJamaicanJapaneseJordanianKenyanKiowaKoreanLaotianLatvianLebaneseLiberianLithuanianLumbeeLuxembourgerMacedonianMalaysianMalteseMarshalleseMenomineeMexicanMexican American IndianMongolianMoroccanNative HawaiianNavajoNepaleseNew ZealanderNicaraguanNigerianNorthern EuropeanNorwegianOkinawanOsageOttawaPaiutePakistaniPalestinianPanamanianParaguayanPennsylvania GermanPeruvianPimaPolishPortuguesePotawatomiPuebloPuerto RicanPuget Sound SalishRomanianRussianSalvadoranSamoanScandinavianScotch-IrishScottishSeminoleSenegaleseSerbianShoshoneSierra LeoneanSiouxSlavicSlovakSloveneSomaliSouth AfricanSouth AmericanSouth American IndianSoviet UnionSpaniardSpanishSpanish AmericanSpanish American IndianSri LankanSubsaharan AfricanSudaneseSwedishSwissSyrianTaiwaneseThaiTlingit-HaidaTohono O'OdhamTonganTrinidadian and TobagonianTsimshianTurkishU.S. Virgin IslanderUgandanUkrainianUruguayanUteVenezuelanVietnameseWelshWest IndianYakamaYaquiYugoslavianYumanYup'ikZimbabwean
Immigration
NonimmigrantsImmigrantsAfghanistanAfricaAlbaniaArgentinaArmeniaAsiaAustraliaAustriaBahamasBangladeshBarbadosBelarusBelgiumBelizeBoliviaBosnia and HerzegovinaBrazilBulgariaBurma/MyanmarCabo VerdeCambodiaCameroonCanadaCaribbeanCentral AmericaChileChinaColombiaCongoCosta RicaCroatiaCubaCzechoslovakiaDenmarkDominicaDominican RepublicEastern AfricaEastern AsiaEastern EuropeEcuadorEgyptEl SalvadorEnglandEritreaEthiopiaEuropeFijiFranceGermanyGhanaGreeceGrenadaGuatemalaGuyanaHaitiHondurasHong KongHungaryIndiaIndonesiaIranIraqIrelandIsraelItalyJamaicaJapanJordanKazakhstanKenyaKoreaKuwaitLaosLatin AmericaLatviaLebanonLiberiaLithuaniaMalaysiaMexicoMicronesiaMiddle AfricaMoldovaMoroccoNepalNetherlandsNicaraguaNigeriaNorth AmericaNorth MacedoniaNorthern AfricaNorthern EuropeNorwayOceaniaPakistanPanamaPeruPhilippinesPolandPortugalRomaniaRussiaSaudi ArabiaScotlandSenegalSerbiaSierra LeoneSingaporeSomaliaSouth AfricaSouth AmericaSouth Central AsiaSouth Eastern AsiaSouthern EuropeSpainSri LankaSt. Vincent and the GrenadinesSudanSwedenSwitzerlandSyriaTaiwanThailandTrinidad and TobagoTurkeyUgandaUkraineUruguayUzbekistanVenezuelaVietnamWest IndiesWestern AfricaWestern AsiaWestern EuropeYemenZaireZimbabweAzores
Croatian
Race
Ancestry
AfghanAfricanAlaska NativeAlaskan AthabascanAlbanianAleutAlsatianAmericanApacheArabArapahoArgentineanArmenianAssyrian/Chaldean/SyriacAustralianAustrianBahamianBangladeshiBarbadianBasqueBelgianBelizeanBermudanBhutaneseBlackfeetBolivianBrazilianBritishBritish West IndianBulgarianBurmeseCajunCambodianCanadianCape VerdeanCarpatho RusynCelticCentral AmericanCentral American IndianCherokeeCheyenneChickasawChileanChineseChippewaChoctawColombianColvilleComancheCosta RicanCreeCreekCroatianCrowCubanCypriotCzechCzechoslovakianDanishDelawareDominicanDutchDutch West IndianEastern EuropeanEcuadorianEgyptianEnglishEstonianEthiopianEuropeanFijianFilipinoFinnishFrenchFrench American IndianFrench CanadianGermanGerman RussianGhanaianGreekGuamanian/ChamorroGuatemalanGuyaneseHaitianHmongHonduranHopiHoumaHungarianIcelanderIndian (Asian)IndonesianInupiatIranianIraqiIrishIroquoisIsraeliItalianJamaicanJapaneseJordanianKenyanKiowaKoreanLaotianLatvianLebaneseLiberianLithuanianLumbeeLuxembourgerMacedonianMalaysianMalteseMarshalleseMenomineeMexicanMexican American IndianMongolianMoroccanNative HawaiianNavajoNepaleseNew ZealanderNicaraguanNigerianNorthern EuropeanNorwegianOkinawanOsageOttawaPaiutePakistaniPalestinianPanamanianParaguayanPennsylvania GermanPeruvianPimaPolishPortuguesePotawatomiPuebloPuerto RicanPuget Sound SalishRomanianRussianSalvadoranSamoanScandinavianScotch-IrishScottishSeminoleSenegaleseSerbianShoshoneSierra LeoneanSiouxSlavicSlovakSloveneSomaliSouth AfricanSouth AmericanSouth American IndianSoviet UnionSpaniardSpanishSpanish AmericanSpanish American IndianSri LankanSubsaharan AfricanSudaneseSwedishSwissSyrianTaiwaneseThaiTlingit-HaidaTohono O'OdhamTonganTrinidadian and TobagonianTsimshianTurkishU.S. Virgin IslanderUgandanUkrainianUruguayanUteVenezuelanVietnameseWelshWest IndianYakamaYaquiYugoslavianYumanYup'ikZimbabwean
Immigration
NonimmigrantsImmigrantsAfghanistanAfricaAlbaniaArgentinaArmeniaAsiaAustraliaAustriaBahamasBangladeshBarbadosBelarusBelgiumBelizeBoliviaBosnia and HerzegovinaBrazilBulgariaBurma/MyanmarCabo VerdeCambodiaCameroonCanadaCaribbeanCentral AmericaChileChinaColombiaCongoCosta RicaCroatiaCubaCzechoslovakiaDenmarkDominicaDominican RepublicEastern AfricaEastern AsiaEastern EuropeEcuadorEgyptEl SalvadorEnglandEritreaEthiopiaEuropeFijiFranceGermanyGhanaGreeceGrenadaGuatemalaGuyanaHaitiHondurasHong KongHungaryIndiaIndonesiaIranIraqIrelandIsraelItalyJamaicaJapanJordanKazakhstanKenyaKoreaKuwaitLaosLatin AmericaLatviaLebanonLiberiaLithuaniaMalaysiaMexicoMicronesiaMiddle AfricaMoldovaMoroccoNepalNetherlandsNicaraguaNigeriaNorth AmericaNorth MacedoniaNorthern AfricaNorthern EuropeNorwayOceaniaPakistanPanamaPeruPhilippinesPolandPortugalRomaniaRussiaSaudi ArabiaScotlandSenegalSerbiaSierra LeoneSingaporeSomaliaSouth AfricaSouth AmericaSouth Central AsiaSouth Eastern AsiaSouthern EuropeSpainSri LankaSudanSwedenSwitzerlandSyriaTaiwanThailandTrinidad and TobagoTurkeyUgandaUkraineUruguayUzbekistanVenezuelaVietnamWest IndiesWestern AfricaWestern AsiaWestern EuropeYemenZaireZimbabweAzores
Births to Unmarried Women
Income
Poverty
Unemployment
Labor Participation
Family Structure
Vehicle Availability
Education Level
Disability

Births to Unmarried Women Comparison

Immigrants from St. Vincent and the Grenadines

Croatians

Tragic
Excellent
37.3%
BIRTHS TO UNMARRIED WOMEN
0.1/ 100
METRIC RATING
280th/ 347
METRIC RANK
30.2%
BIRTHS TO UNMARRIED WOMEN
88.0/ 100
METRIC RATING
124th/ 347
METRIC RANK

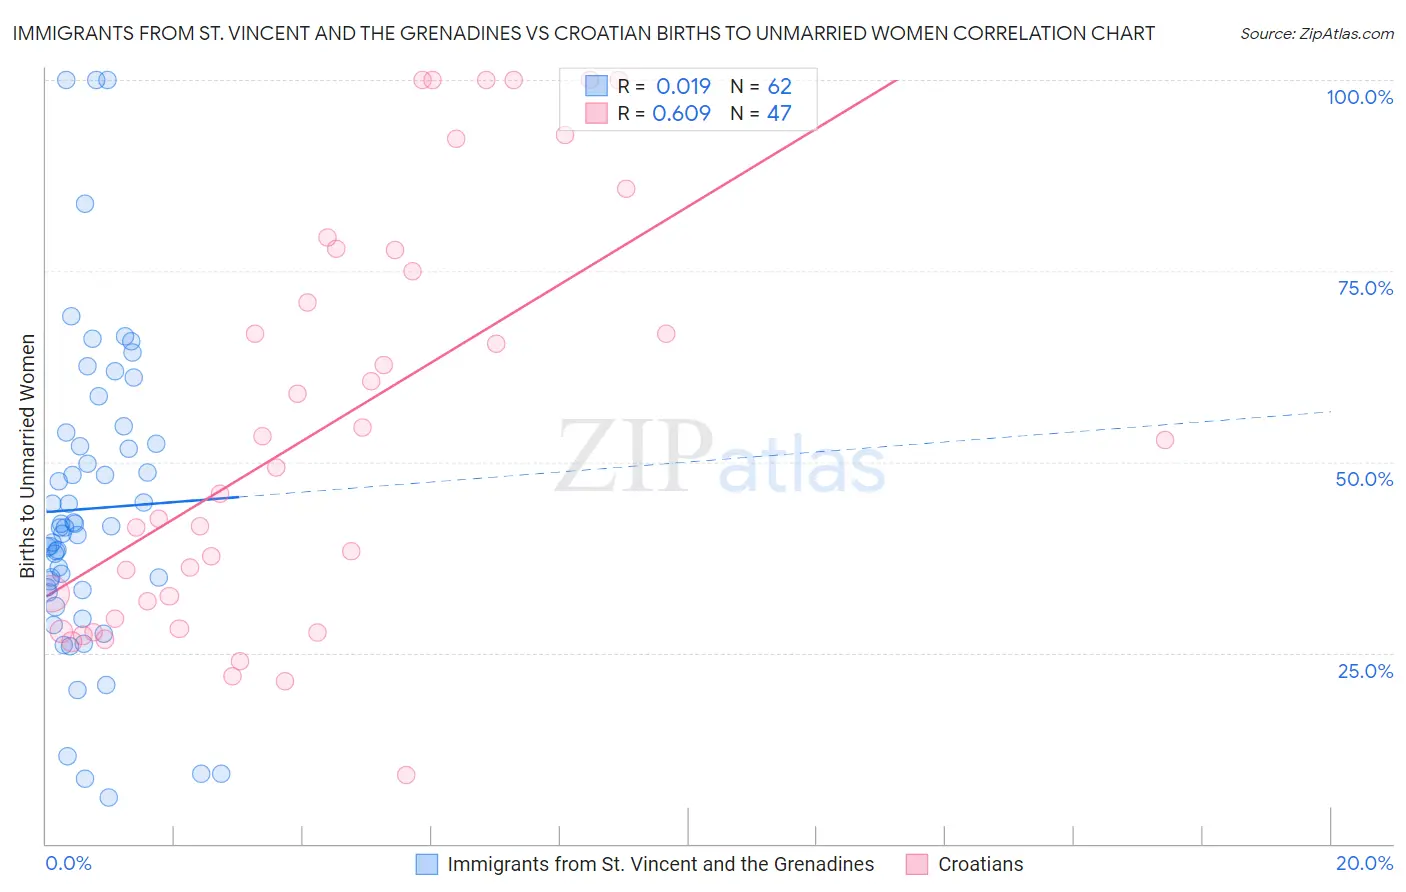
Immigrants from St. Vincent and the Grenadines vs Croatian Births to Unmarried Women Correlation Chart

The statistical analysis conducted on geographies consisting of 55,457,752 people shows no correlation between the proportion of Immigrants from St. Vincent and the Grenadines and percentage of births to unmarried women in the United States with a correlation coefficient (R) of 0.019 and weighted average of 37.3%. Similarly, the statistical analysis conducted on geographies consisting of 347,705,559 people shows a significant positive correlation between the proportion of Croatians and percentage of births to unmarried women in the United States with a correlation coefficient (R) of 0.609 and weighted average of 30.2%, a difference of 23.7%.
Immigrants from St. Vincent and the Grenadines vs Croatian Births to Unmarried Women

Births to Unmarried Women Correlation Summary

MeasurementImmigrants from St. Vincent and the GrenadinesCroatian
Minimum6.0%9.0%
Maximum100.0%100.0%
Range94.0%91.0%
Mean43.9%54.4%
Median41.5%49.3%
Interquartile 25% (IQ1)33.3%29.4%
Interquartile 75% (IQ3)52.4%77.8%
Interquartile Range (IQR)19.1%48.4%
Standard Deviation (Sample)20.4%27.0%
Standard Deviation (Population)20.2%26.7%

Similar Demographics by Births to Unmarried Women

Demographics Similar to Immigrants from St. Vincent and the Grenadines by Births to Unmarried Women

In terms of births to unmarried women, the demographic groups most similar to Immigrants from St. Vincent and the Grenadines are Immigrants from Belize (37.3%, a difference of 0.020%), West Indian (37.3%, a difference of 0.12%), Liberian (37.4%, a difference of 0.18%), Spanish American Indian (37.4%, a difference of 0.26%), and Immigrants from Central America (37.4%, a difference of 0.33%).
DemographicsRating | RankBirths to Unmarried Women
Mexicans
0.1
/100
|
#273
Tragic
36.9%
Cree
0.1
/100
|
#274
Tragic
37.0%
Barbadians
0.1
/100
|
#275
Tragic
37.0%
Belizeans
0.1
/100
|
#276
Tragic
37.0%
Guatemalans
0.1
/100
|
#277
Tragic
37.1%
Immigrants | Latin America
0.1
/100
|
#278
Tragic
37.1%
West Indians
0.1
/100
|
#279
Tragic
37.3%
Immigrants | St. Vincent and the Grenadines
0.1
/100
|
#280
Tragic
37.3%
Immigrants | Belize
0.1
/100
|
#281
Tragic
37.3%
Liberians
0.0
/100
|
#282
Tragic
37.4%
Spanish American Indians
0.0
/100
|
#283
Tragic
37.4%
Immigrants | Central America
0.0
/100
|
#284
Tragic
37.4%
Immigrants | Mexico
0.0
/100
|
#285
Tragic
37.5%
Immigrants | Guatemala
0.0
/100
|
#286
Tragic
37.5%
Creek
0.0
/100
|
#287
Tragic
37.6%

Demographics Similar to Croatians by Births to Unmarried Women

In terms of births to unmarried women, the demographic groups most similar to Croatians are Syrian (30.2%, a difference of 0.040%), Vietnamese (30.2%, a difference of 0.070%), Immigrants from Argentina (30.1%, a difference of 0.17%), European (30.2%, a difference of 0.19%), and Korean (30.1%, a difference of 0.21%).
DemographicsRating | RankBirths to Unmarried Women
Immigrants | Netherlands
91.1
/100
|
#117
Exceptional
29.9%
Immigrants | Norway
91.0
/100
|
#118
Exceptional
29.9%
Argentineans
90.5
/100
|
#119
Exceptional
30.0%
Ugandans
89.2
/100
|
#120
Excellent
30.1%
Koreans
88.9
/100
|
#121
Excellent
30.1%
Immigrants | Argentina
88.7
/100
|
#122
Excellent
30.1%
Syrians
88.2
/100
|
#123
Excellent
30.2%
Croatians
88.0
/100
|
#124
Excellent
30.2%
Vietnamese
87.7
/100
|
#125
Excellent
30.2%
Europeans
87.2
/100
|
#126
Excellent
30.2%
Chinese
87.1
/100
|
#127
Excellent
30.2%
Icelanders
86.0
/100
|
#128
Excellent
30.3%
Immigrants | Spain
85.8
/100
|
#129
Excellent
30.3%
Immigrants | Bosnia and Herzegovina
85.7
/100
|
#130
Excellent
30.3%
Immigrants | Zimbabwe
85.7
/100
|
#131
Excellent
30.3%