Immigrants from Sri Lanka vs Delaware Family Households

COMPARE

Immigrants from Sri Lanka
Race
Ancestry
AfghanAfricanAlaska NativeAlaskan AthabascanAlbanianAleutAlsatianAmericanApacheArabArapahoArgentineanArmenianAssyrian/Chaldean/SyriacAustralianAustrianBahamianBangladeshiBarbadianBasqueBelgianBelizeanBermudanBhutaneseBlackfeetBolivianBrazilianBritishBritish West IndianBulgarianBurmeseCajunCambodianCanadianCape VerdeanCarpatho RusynCelticCentral AmericanCentral American IndianCherokeeCheyenneChickasawChileanChineseChippewaChoctawColombianColvilleComancheCosta RicanCreeCreekCroatianCrowCubanCypriotCzechCzechoslovakianDanishDominicanDutchDutch West IndianEastern EuropeanEcuadorianEgyptianEnglishEstonianEthiopianEuropeanFijianFilipinoFinnishFrenchFrench American IndianFrench CanadianGermanGerman RussianGhanaianGreekGuamanian/ChamorroGuatemalanGuyaneseHaitianHmongHonduranHopiHoumaHungarianIcelanderIndian (Asian)IndonesianInupiatIranianIraqiIrishIroquoisIsraeliItalianJamaicanJapaneseJordanianKenyanKiowaKoreanLaotianLatvianLebaneseLiberianLithuanianLumbeeLuxembourgerMacedonianMalaysianMalteseMarshalleseMenomineeMexicanMexican American IndianMongolianMoroccanNative HawaiianNavajoNepaleseNew ZealanderNicaraguanNigerianNorthern EuropeanNorwegianOkinawanOsageOttawaPaiutePakistaniPalestinianPanamanianParaguayanPennsylvania GermanPeruvianPimaPolishPortuguesePotawatomiPuebloPuerto RicanPuget Sound SalishRomanianRussianSalvadoranSamoanScandinavianScotch-IrishScottishSeminoleSenegaleseSerbianShoshoneSierra LeoneanSiouxSlavicSlovakSloveneSomaliSouth AfricanSouth AmericanSouth American IndianSoviet UnionSpaniardSpanishSpanish AmericanSpanish American IndianSri LankanSubsaharan AfricanSudaneseSwedishSwissSyrianTaiwaneseThaiTlingit-HaidaTohono O'OdhamTonganTrinidadian and TobagonianTsimshianTurkishU.S. Virgin IslanderUgandanUkrainianUruguayanUteVenezuelanVietnameseWelshWest IndianYakamaYaquiYugoslavianYumanYup'ikZimbabwean
Immigration
NonimmigrantsImmigrantsAfghanistanAfricaAlbaniaArgentinaArmeniaAsiaAustraliaAustriaBahamasBangladeshBarbadosBelarusBelgiumBelizeBoliviaBosnia and HerzegovinaBrazilBulgariaBurma/MyanmarCabo VerdeCambodiaCameroonCanadaCaribbeanCentral AmericaChileChinaColombiaCongoCosta RicaCroatiaCubaCzechoslovakiaDenmarkDominicaDominican RepublicEastern AfricaEastern AsiaEastern EuropeEcuadorEgyptEl SalvadorEnglandEritreaEthiopiaEuropeFijiFranceGermanyGhanaGreeceGrenadaGuatemalaGuyanaHaitiHondurasHong KongHungaryIndiaIndonesiaIranIraqIrelandIsraelItalyJamaicaJapanJordanKazakhstanKenyaKoreaKuwaitLaosLatin AmericaLatviaLebanonLiberiaLithuaniaMalaysiaMexicoMicronesiaMiddle AfricaMoldovaMoroccoNepalNetherlandsNicaraguaNigeriaNorth AmericaNorth MacedoniaNorthern AfricaNorthern EuropeNorwayOceaniaPakistanPanamaPeruPhilippinesPolandPortugalRomaniaRussiaSaudi ArabiaScotlandSenegalSerbiaSierra LeoneSingaporeSomaliaSouth AfricaSouth AmericaSouth Central AsiaSouth Eastern AsiaSouthern EuropeSpainSri LankaSt. Vincent and the GrenadinesSudanSwedenSwitzerlandSyriaTaiwanThailandTrinidad and TobagoTurkeyUgandaUkraineUruguayUzbekistanVenezuelaVietnamWest IndiesWestern AfricaWestern AsiaWestern EuropeYemenZaireZimbabweAzores
Delaware
Race
Ancestry
AfghanAfricanAlaska NativeAlaskan AthabascanAlbanianAleutAlsatianAmericanApacheArabArapahoArgentineanArmenianAssyrian/Chaldean/SyriacAustralianAustrianBahamianBangladeshiBarbadianBasqueBelgianBelizeanBermudanBhutaneseBlackfeetBolivianBrazilianBritishBritish West IndianBulgarianBurmeseCajunCambodianCanadianCape VerdeanCarpatho RusynCelticCentral AmericanCentral American IndianCherokeeCheyenneChickasawChileanChineseChippewaChoctawColombianColvilleComancheCosta RicanCreeCreekCroatianCrowCubanCypriotCzechCzechoslovakianDanishDelawareDominicanDutchDutch West IndianEastern EuropeanEcuadorianEgyptianEnglishEstonianEthiopianEuropeanFijianFilipinoFinnishFrenchFrench American IndianFrench CanadianGermanGerman RussianGhanaianGreekGuamanian/ChamorroGuatemalanGuyaneseHaitianHmongHonduranHopiHoumaHungarianIcelanderIndian (Asian)IndonesianInupiatIranianIraqiIrishIroquoisIsraeliItalianJamaicanJapaneseJordanianKenyanKiowaKoreanLaotianLatvianLebaneseLiberianLithuanianLumbeeLuxembourgerMacedonianMalaysianMalteseMarshalleseMenomineeMexicanMexican American IndianMongolianMoroccanNative HawaiianNavajoNepaleseNew ZealanderNicaraguanNigerianNorthern EuropeanNorwegianOkinawanOsageOttawaPaiutePakistaniPalestinianPanamanianParaguayanPennsylvania GermanPeruvianPimaPolishPortuguesePotawatomiPuebloPuerto RicanPuget Sound SalishRomanianRussianSalvadoranSamoanScandinavianScotch-IrishScottishSeminoleSenegaleseSerbianShoshoneSierra LeoneanSiouxSlavicSlovakSloveneSomaliSouth AfricanSouth AmericanSouth American IndianSoviet UnionSpaniardSpanishSpanish AmericanSpanish American IndianSri LankanSubsaharan AfricanSudaneseSwedishSwissSyrianTaiwaneseThaiTlingit-HaidaTohono O'OdhamTonganTrinidadian and TobagonianTsimshianTurkishU.S. Virgin IslanderUgandanUkrainianUruguayanUteVenezuelanVietnameseWelshWest IndianYakamaYaquiYugoslavianYumanYup'ikZimbabwean
Immigration
NonimmigrantsImmigrantsAfghanistanAfricaAlbaniaArgentinaArmeniaAsiaAustraliaAustriaBahamasBangladeshBarbadosBelarusBelgiumBelizeBoliviaBosnia and HerzegovinaBrazilBulgariaBurma/MyanmarCabo VerdeCambodiaCameroonCanadaCaribbeanCentral AmericaChileChinaColombiaCongoCosta RicaCroatiaCubaCzechoslovakiaDenmarkDominicaDominican RepublicEastern AfricaEastern AsiaEastern EuropeEcuadorEgyptEl SalvadorEnglandEritreaEthiopiaEuropeFijiFranceGermanyGhanaGreeceGrenadaGuatemalaGuyanaHaitiHondurasHong KongHungaryIndiaIndonesiaIranIraqIrelandIsraelItalyJamaicaJapanJordanKazakhstanKenyaKoreaKuwaitLaosLatin AmericaLatviaLebanonLiberiaLithuaniaMalaysiaMexicoMicronesiaMiddle AfricaMoldovaMoroccoNepalNetherlandsNicaraguaNigeriaNorth AmericaNorth MacedoniaNorthern AfricaNorthern EuropeNorwayOceaniaPakistanPanamaPeruPhilippinesPolandPortugalRomaniaRussiaSaudi ArabiaScotlandSenegalSerbiaSierra LeoneSingaporeSomaliaSouth AfricaSouth AmericaSouth Central AsiaSouth Eastern AsiaSouthern EuropeSpainSt. Vincent and the GrenadinesSudanSwedenSwitzerlandSyriaTaiwanThailandTrinidad and TobagoTurkeyUgandaUkraineUruguayUzbekistanVenezuelaVietnamWest IndiesWestern AfricaWestern AsiaWestern EuropeYemenZaireZimbabweAzores
Family Households
Income
Poverty
Unemployment
Labor Participation
Family Structure
Vehicle Availability
Education Level
Disability

Family Households Comparison

Immigrants from Sri Lanka

Delaware

Exceptional
Good
65.1%
FAMILY HOUSEHOLDS
98.0/ 100
METRIC RATING
102nd/ 347
METRIC RANK
64.6%
FAMILY HOUSEHOLDS
76.3/ 100
METRIC RATING
148th/ 347
METRIC RANK

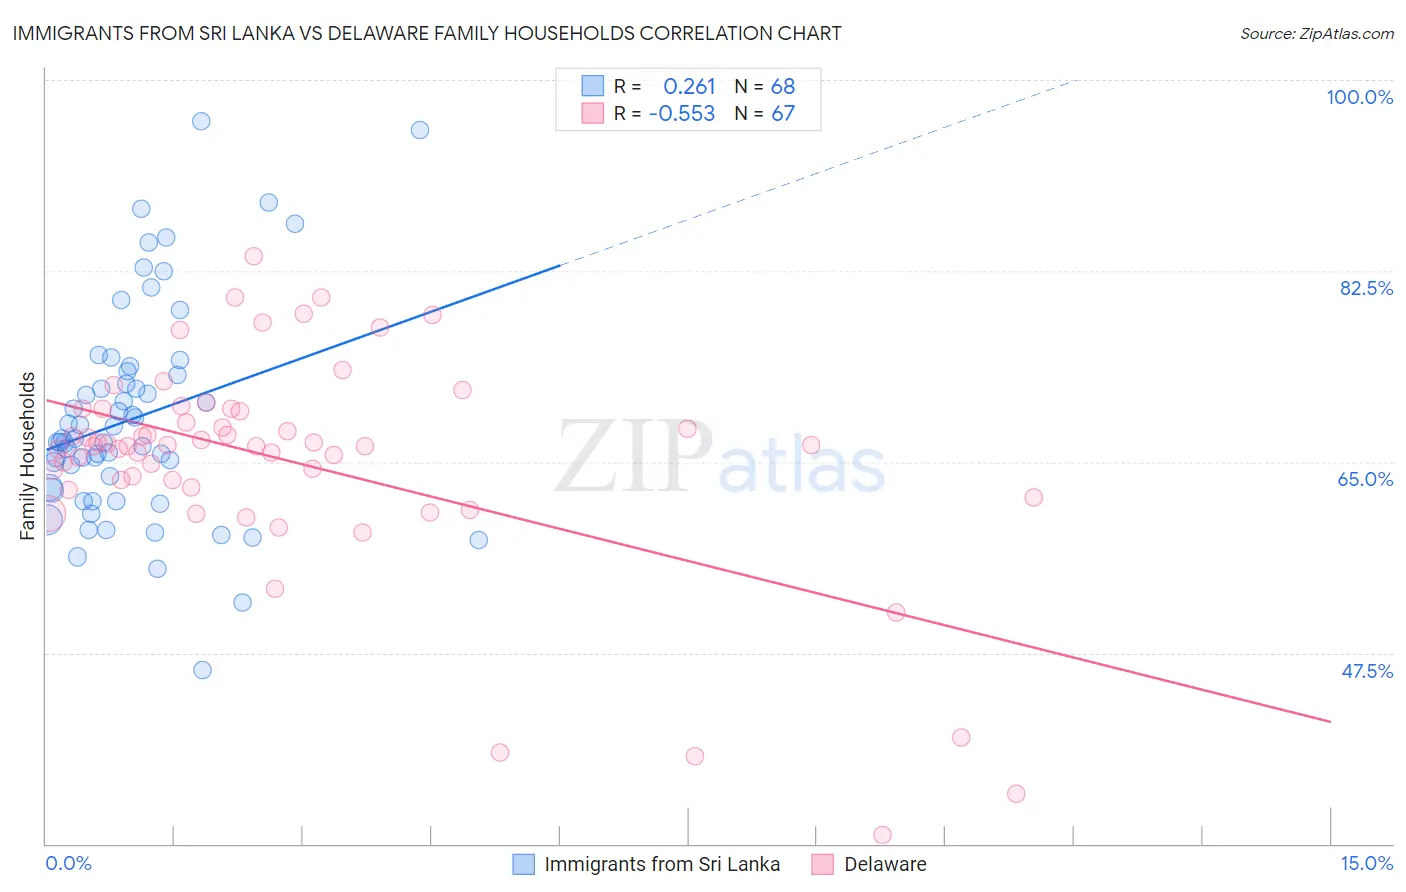
Immigrants from Sri Lanka vs Delaware Family Households Correlation Chart

The statistical analysis conducted on geographies consisting of 149,689,020 people shows a weak positive correlation between the proportion of Immigrants from Sri Lanka and percentage of family households in the United States with a correlation coefficient (R) of 0.261 and weighted average of 65.1%. Similarly, the statistical analysis conducted on geographies consisting of 96,227,636 people shows a substantial negative correlation between the proportion of Delaware and percentage of family households in the United States with a correlation coefficient (R) of -0.553 and weighted average of 64.6%, a difference of 0.91%.
Immigrants from Sri Lanka vs Delaware Family Households

Family Households Correlation Summary

MeasurementImmigrants from Sri LankaDelaware
Minimum45.9%30.8%
Maximum96.3%83.8%
Range50.3%53.1%
Mean69.0%65.0%
Median67.0%66.5%
Interquartile 25% (IQ1)62.5%62.6%
Interquartile 75% (IQ3)73.1%69.9%
Interquartile Range (IQR)10.6%7.2%
Standard Deviation (Sample)9.9%10.2%
Standard Deviation (Population)9.8%10.1%

Similar Demographics by Family Households

Demographics Similar to Immigrants from Sri Lanka by Family Households

In terms of family households, the demographic groups most similar to Immigrants from Sri Lanka are Haitian (65.2%, a difference of 0.020%), Chilean (65.2%, a difference of 0.020%), Indian (Asian) (65.1%, a difference of 0.020%), Spaniard (65.1%, a difference of 0.020%), and Central American Indian (65.2%, a difference of 0.060%).
DemographicsRating | RankFamily Households
Immigrants | Portugal
98.6
/100
|
#95
Exceptional
65.2%
Swiss
98.6
/100
|
#96
Exceptional
65.2%
Guatemalans
98.6
/100
|
#97
Exceptional
65.2%
Immigrants | Syria
98.4
/100
|
#98
Exceptional
65.2%
Central American Indians
98.3
/100
|
#99
Exceptional
65.2%
Haitians
98.1
/100
|
#100
Exceptional
65.2%
Chileans
98.1
/100
|
#101
Exceptional
65.2%
Immigrants | Sri Lanka
98.0
/100
|
#102
Exceptional
65.1%
Indians (Asian)
97.9
/100
|
#103
Exceptional
65.1%
Spaniards
97.8
/100
|
#104
Exceptional
65.1%
English
97.4
/100
|
#105
Exceptional
65.1%
Whites/Caucasians
97.3
/100
|
#106
Exceptional
65.1%
Alaska Natives
97.3
/100
|
#107
Exceptional
65.1%
Palestinians
97.2
/100
|
#108
Exceptional
65.1%
Immigrants | Guatemala
96.9
/100
|
#109
Exceptional
65.0%

Demographics Similar to Delaware by Family Households

In terms of family households, the demographic groups most similar to Delaware are Immigrants from Chile (64.6%, a difference of 0.0%), Sioux (64.6%, a difference of 0.0%), Immigrants from Romania (64.6%, a difference of 0.010%), Romanian (64.5%, a difference of 0.020%), and Syrian (64.5%, a difference of 0.020%).
DemographicsRating | RankFamily Households
Immigrants | Cameroon
84.8
/100
|
#141
Excellent
64.7%
Pakistanis
84.0
/100
|
#142
Excellent
64.7%
Czechoslovakians
82.1
/100
|
#143
Excellent
64.6%
South American Indians
81.9
/100
|
#144
Excellent
64.6%
Welsh
80.1
/100
|
#145
Excellent
64.6%
Immigrants | Romania
77.0
/100
|
#146
Good
64.6%
Immigrants | Chile
76.5
/100
|
#147
Good
64.6%
Delaware
76.3
/100
|
#148
Good
64.6%
Sioux
76.3
/100
|
#149
Good
64.6%
Romanians
75.3
/100
|
#150
Good
64.5%
Syrians
75.2
/100
|
#151
Good
64.5%
Scottish
70.9
/100
|
#152
Good
64.5%
Swedes
69.8
/100
|
#153
Good
64.5%
Austrians
68.5
/100
|
#154
Good
64.5%
Uruguayans
67.7
/100
|
#155
Good
64.5%