Immigrants from Spain vs Immigrants from Austria Divorced or Separated

COMPARE

Immigrants from Spain
Race
Ancestry
AfghanAfricanAlaska NativeAlaskan AthabascanAlbanianAleutAlsatianAmericanApacheArabArapahoArgentineanArmenianAssyrian/Chaldean/SyriacAustralianAustrianBahamianBangladeshiBarbadianBasqueBelgianBelizeanBermudanBhutaneseBlackfeetBolivianBrazilianBritishBritish West IndianBulgarianBurmeseCajunCambodianCanadianCape VerdeanCarpatho RusynCelticCentral AmericanCentral American IndianCherokeeCheyenneChickasawChileanChineseChippewaChoctawColombianColvilleComancheCosta RicanCreeCreekCroatianCrowCubanCypriotCzechCzechoslovakianDanishDelawareDominicanDutchDutch West IndianEastern EuropeanEcuadorianEgyptianEnglishEstonianEthiopianEuropeanFijianFilipinoFinnishFrenchFrench American IndianFrench CanadianGermanGerman RussianGhanaianGreekGuamanian/ChamorroGuatemalanGuyaneseHaitianHmongHonduranHopiHoumaHungarianIcelanderIndian (Asian)IndonesianInupiatIranianIraqiIrishIroquoisIsraeliItalianJamaicanJapaneseJordanianKenyanKiowaKoreanLaotianLatvianLebaneseLiberianLithuanianLumbeeLuxembourgerMacedonianMalaysianMalteseMarshalleseMenomineeMexicanMexican American IndianMongolianMoroccanNative HawaiianNavajoNepaleseNew ZealanderNicaraguanNigerianNorthern EuropeanNorwegianOkinawanOsageOttawaPaiutePakistaniPalestinianPanamanianParaguayanPennsylvania GermanPeruvianPimaPolishPortuguesePotawatomiPuebloPuerto RicanPuget Sound SalishRomanianRussianSalvadoranSamoanScandinavianScotch-IrishScottishSeminoleSenegaleseSerbianShoshoneSierra LeoneanSiouxSlavicSlovakSloveneSomaliSouth AfricanSouth AmericanSouth American IndianSoviet UnionSpaniardSpanishSpanish AmericanSpanish American IndianSri LankanSubsaharan AfricanSudaneseSwedishSwissSyrianTaiwaneseThaiTlingit-HaidaTohono O'OdhamTonganTrinidadian and TobagonianTsimshianTurkishU.S. Virgin IslanderUgandanUkrainianUruguayanUteVenezuelanVietnameseWelshWest IndianYakamaYaquiYugoslavianYumanYup'ikZimbabwean
Immigration
NonimmigrantsImmigrantsAfghanistanAfricaAlbaniaArgentinaArmeniaAsiaAustraliaBahamasBangladeshBarbadosBelarusBelgiumBelizeBoliviaBosnia and HerzegovinaBrazilBulgariaBurma/MyanmarCabo VerdeCambodiaCameroonCanadaCaribbeanCentral AmericaChileChinaColombiaCongoCosta RicaCroatiaCubaCzechoslovakiaDenmarkDominicaDominican RepublicEastern AfricaEastern AsiaEastern EuropeEcuadorEgyptEl SalvadorEnglandEritreaEthiopiaEuropeFijiFranceGermanyGhanaGreeceGrenadaGuatemalaGuyanaHaitiHondurasHong KongHungaryIndiaIndonesiaIranIraqIrelandIsraelItalyJamaicaJapanJordanKazakhstanKenyaKoreaKuwaitLaosLatin AmericaLatviaLebanonLiberiaLithuaniaMalaysiaMexicoMicronesiaMiddle AfricaMoldovaMoroccoNepalNetherlandsNicaraguaNigeriaNorth AmericaNorth MacedoniaNorthern AfricaNorthern EuropeNorwayOceaniaPakistanPanamaPeruPhilippinesPolandPortugalRomaniaRussiaSaudi ArabiaScotlandSenegalSerbiaSierra LeoneSingaporeSomaliaSouth AfricaSouth AmericaSouth Central AsiaSouth Eastern AsiaSouthern EuropeSpainSri LankaSt. Vincent and the GrenadinesSudanSwedenSwitzerlandSyriaTaiwanThailandTrinidad and TobagoTurkeyUgandaUkraineUruguayUzbekistanVenezuelaVietnamWest IndiesWestern AfricaWestern AsiaWestern EuropeYemenZaireZimbabweAzores
Immigrants from Austria
Race
Ancestry
AfghanAfricanAlaska NativeAlaskan AthabascanAlbanianAleutAlsatianAmericanApacheArabArapahoArgentineanArmenianAssyrian/Chaldean/SyriacAustralianAustrianBahamianBangladeshiBarbadianBasqueBelgianBelizeanBermudanBhutaneseBlackfeetBolivianBrazilianBritishBritish West IndianBulgarianBurmeseCajunCambodianCanadianCape VerdeanCarpatho RusynCelticCentral AmericanCentral American IndianCherokeeCheyenneChickasawChileanChineseChippewaChoctawColombianColvilleComancheCosta RicanCreeCreekCroatianCrowCubanCypriotCzechCzechoslovakianDanishDelawareDominicanDutchDutch West IndianEastern EuropeanEcuadorianEgyptianEnglishEstonianEthiopianEuropeanFijianFilipinoFinnishFrenchFrench American IndianFrench CanadianGermanGerman RussianGhanaianGreekGuamanian/ChamorroGuatemalanGuyaneseHaitianHmongHonduranHopiHoumaHungarianIcelanderIndian (Asian)IndonesianInupiatIranianIraqiIrishIroquoisIsraeliItalianJamaicanJapaneseJordanianKenyanKiowaKoreanLaotianLatvianLebaneseLiberianLithuanianLumbeeLuxembourgerMacedonianMalaysianMalteseMarshalleseMenomineeMexicanMexican American IndianMongolianMoroccanNative HawaiianNavajoNepaleseNew ZealanderNicaraguanNigerianNorthern EuropeanNorwegianOkinawanOsageOttawaPaiutePakistaniPalestinianPanamanianParaguayanPennsylvania GermanPeruvianPimaPolishPortuguesePotawatomiPuebloPuerto RicanPuget Sound SalishRomanianRussianSalvadoranSamoanScandinavianScotch-IrishScottishSeminoleSenegaleseSerbianShoshoneSierra LeoneanSiouxSlavicSlovakSloveneSomaliSouth AfricanSouth AmericanSouth American IndianSoviet UnionSpaniardSpanishSpanish AmericanSpanish American IndianSri LankanSubsaharan AfricanSudaneseSwedishSwissSyrianTaiwaneseThaiTlingit-HaidaTohono O'OdhamTonganTrinidadian and TobagonianTsimshianTurkishU.S. Virgin IslanderUgandanUkrainianUruguayanUteVenezuelanVietnameseWelshWest IndianYakamaYaquiYugoslavianYumanYup'ikZimbabwean
Immigration
NonimmigrantsImmigrantsAfghanistanAfricaAlbaniaArgentinaArmeniaAsiaAustraliaAustriaBahamasBangladeshBarbadosBelarusBelgiumBelizeBoliviaBosnia and HerzegovinaBrazilBulgariaBurma/MyanmarCabo VerdeCambodiaCameroonCanadaCaribbeanCentral AmericaChileChinaColombiaCongoCosta RicaCroatiaCubaCzechoslovakiaDenmarkDominicaDominican RepublicEastern AfricaEastern AsiaEastern EuropeEcuadorEgyptEl SalvadorEnglandEritreaEthiopiaEuropeFijiFranceGermanyGhanaGreeceGrenadaGuatemalaGuyanaHaitiHondurasHong KongHungaryIndiaIndonesiaIranIraqIrelandIsraelItalyJamaicaJapanJordanKazakhstanKenyaKoreaKuwaitLaosLatin AmericaLatviaLebanonLiberiaLithuaniaMalaysiaMexicoMicronesiaMiddle AfricaMoldovaMoroccoNepalNetherlandsNicaraguaNigeriaNorth AmericaNorth MacedoniaNorthern AfricaNorthern EuropeNorwayOceaniaPakistanPanamaPeruPhilippinesPolandPortugalRomaniaRussiaSaudi ArabiaScotlandSenegalSerbiaSierra LeoneSingaporeSomaliaSouth AfricaSouth AmericaSouth Central AsiaSouth Eastern AsiaSouthern EuropeSri LankaSt. Vincent and the GrenadinesSudanSwedenSwitzerlandSyriaTaiwanThailandTrinidad and TobagoTurkeyUgandaUkraineUruguayUzbekistanVenezuelaVietnamWest IndiesWestern AfricaWestern AsiaWestern EuropeYemenZaireZimbabweAzores
Divorced or Separated
Income
Poverty
Unemployment
Labor Participation
Family Structure
Vehicle Availability
Education Level
Disability

Divorced or Separated Comparison

Immigrants from Spain

Immigrants from Austria

Exceptional
Excellent
11.7%
DIVORCED OR SEPARATED
96.8/ 100
METRIC RATING
111th/ 347
METRIC RANK
11.8%
DIVORCED OR SEPARATED
88.2/ 100
METRIC RATING
130th/ 347
METRIC RANK

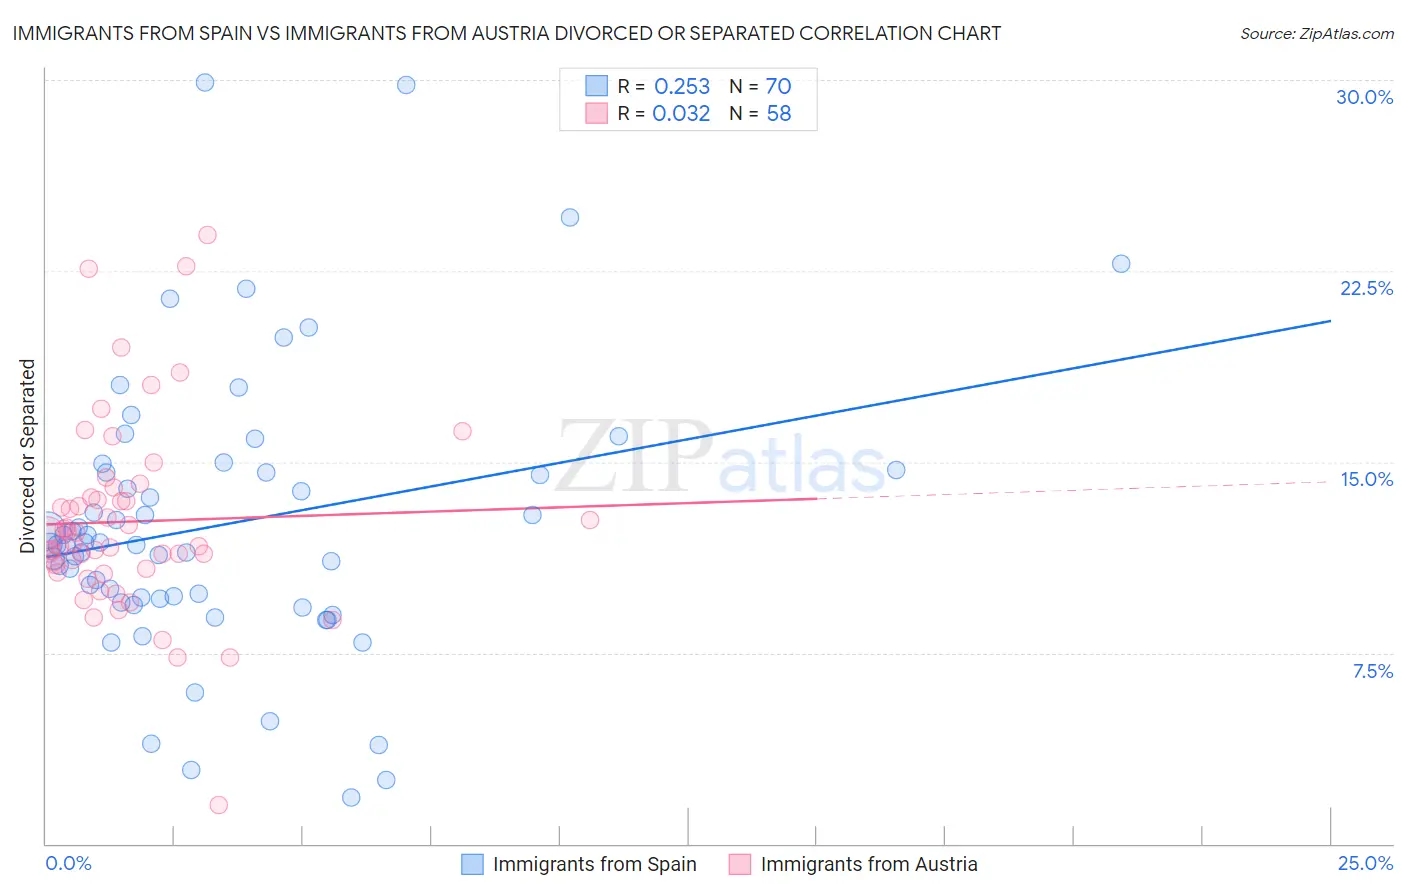
Immigrants from Spain vs Immigrants from Austria Divorced or Separated Correlation Chart

The statistical analysis conducted on geographies consisting of 239,591,348 people shows a weak positive correlation between the proportion of Immigrants from Spain and percentage of population currently divorced or separated in the United States with a correlation coefficient (R) of 0.253 and weighted average of 11.7%. Similarly, the statistical analysis conducted on geographies consisting of 167,967,636 people shows no correlation between the proportion of Immigrants from Austria and percentage of population currently divorced or separated in the United States with a correlation coefficient (R) of 0.032 and weighted average of 11.8%, a difference of 1.2%.
Immigrants from Spain vs Immigrants from Austria Divorced or Separated

Divorced or Separated Correlation Summary

MeasurementImmigrants from SpainImmigrants from Austria
Minimum1.8%1.5%
Maximum29.9%23.9%
Range28.1%22.4%
Mean12.5%12.7%
Median11.8%12.0%
Interquartile 25% (IQ1)9.6%10.8%
Interquartile 75% (IQ3)14.6%13.6%
Interquartile Range (IQR)5.0%2.8%
Standard Deviation (Sample)5.5%3.8%
Standard Deviation (Population)5.4%3.8%

Demographics Similar to Immigrants from Spain and Immigrants from Austria by Divorced or Separated

In terms of divorced or separated, the demographic groups most similar to Immigrants from Spain are Immigrants from Czechoslovakia (11.7%, a difference of 0.040%), Immigrants from France (11.7%, a difference of 0.050%), Estonian (11.7%, a difference of 0.050%), Immigrants from Norway (11.7%, a difference of 0.22%), and Lithuanian (11.7%, a difference of 0.27%). Similarly, the demographic groups most similar to Immigrants from Austria are Immigrants from St. Vincent and the Grenadines (11.8%, a difference of 0.010%), Immigrants from Ecuador (11.8%, a difference of 0.050%), South African (11.8%, a difference of 0.060%), South American Indian (11.8%, a difference of 0.39%), and Ukrainian (11.8%, a difference of 0.41%).
DemographicsRating | RankDivorced or Separated
Immigrants | Czechoslovakia
96.9
/100
|
#110
Exceptional
11.7%
Immigrants | Spain
96.8
/100
|
#111
Exceptional
11.7%
Immigrants | France
96.6
/100
|
#112
Exceptional
11.7%
Estonians
96.6
/100
|
#113
Exceptional
11.7%
Immigrants | Norway
95.9
/100
|
#114
Exceptional
11.7%
Lithuanians
95.7
/100
|
#115
Exceptional
11.7%
Immigrants | Iraq
95.4
/100
|
#116
Exceptional
11.7%
Immigrants | Uganda
95.3
/100
|
#117
Exceptional
11.7%
Ecuadorians
95.3
/100
|
#118
Exceptional
11.7%
Syrians
95.1
/100
|
#119
Exceptional
11.7%
Iraqis
94.6
/100
|
#120
Exceptional
11.8%
Romanians
94.5
/100
|
#121
Exceptional
11.8%
Menominee
93.8
/100
|
#122
Exceptional
11.8%
Immigrants | Immigrants
93.7
/100
|
#123
Exceptional
11.8%
Ugandans
93.1
/100
|
#124
Exceptional
11.8%
Ukrainians
92.3
/100
|
#125
Exceptional
11.8%
South American Indians
92.1
/100
|
#126
Exceptional
11.8%
South Africans
88.9
/100
|
#127
Excellent
11.8%
Immigrants | Ecuador
88.9
/100
|
#128
Excellent
11.8%
Immigrants | St. Vincent and the Grenadines
88.4
/100
|
#129
Excellent
11.8%
Immigrants | Austria
88.2
/100
|
#130
Excellent
11.8%