Immigrants from Southern Europe vs Korean Births to Unmarried Women

COMPARE

Immigrants from Southern Europe
Race
Ancestry
AfghanAfricanAlaska NativeAlaskan AthabascanAlbanianAleutAlsatianAmericanApacheArabArapahoArgentineanArmenianAssyrian/Chaldean/SyriacAustralianAustrianBahamianBangladeshiBarbadianBasqueBelgianBelizeanBermudanBhutaneseBlackfeetBolivianBrazilianBritishBritish West IndianBulgarianBurmeseCajunCambodianCanadianCape VerdeanCarpatho RusynCelticCentral AmericanCentral American IndianCherokeeCheyenneChickasawChileanChineseChippewaChoctawColombianColvilleComancheCosta RicanCreeCreekCroatianCrowCubanCypriotCzechCzechoslovakianDanishDelawareDominicanDutchDutch West IndianEastern EuropeanEcuadorianEgyptianEnglishEstonianEthiopianEuropeanFijianFilipinoFinnishFrenchFrench American IndianFrench CanadianGermanGerman RussianGhanaianGreekGuamanian/ChamorroGuatemalanGuyaneseHaitianHmongHonduranHopiHoumaHungarianIcelanderIndian (Asian)IndonesianInupiatIranianIraqiIrishIroquoisIsraeliItalianJamaicanJapaneseJordanianKenyanKiowaLaotianLatvianLebaneseLiberianLithuanianLumbeeLuxembourgerMacedonianMalaysianMalteseMarshalleseMenomineeMexicanMexican American IndianMongolianMoroccanNative HawaiianNavajoNepaleseNew ZealanderNicaraguanNigerianNorthern EuropeanNorwegianOkinawanOsageOttawaPaiutePakistaniPalestinianPanamanianParaguayanPennsylvania GermanPeruvianPimaPolishPortuguesePotawatomiPuebloPuerto RicanPuget Sound SalishRomanianRussianSalvadoranSamoanScandinavianScotch-IrishScottishSeminoleSenegaleseSerbianShoshoneSierra LeoneanSiouxSlavicSlovakSloveneSomaliSouth AfricanSouth AmericanSouth American IndianSoviet UnionSpaniardSpanishSpanish AmericanSpanish American IndianSri LankanSubsaharan AfricanSudaneseSwedishSwissSyrianTaiwaneseThaiTlingit-HaidaTohono O'OdhamTonganTrinidadian and TobagonianTsimshianTurkishU.S. Virgin IslanderUgandanUkrainianUruguayanUteVenezuelanVietnameseWelshWest IndianYakamaYaquiYugoslavianYumanYup'ikZimbabwean
Immigration
NonimmigrantsImmigrantsAfghanistanAfricaAlbaniaArgentinaArmeniaAsiaAustraliaAustriaBahamasBangladeshBarbadosBelarusBelgiumBelizeBoliviaBosnia and HerzegovinaBrazilBulgariaBurma/MyanmarCabo VerdeCambodiaCameroonCanadaCaribbeanCentral AmericaChileChinaColombiaCongoCosta RicaCroatiaCubaCzechoslovakiaDenmarkDominicaDominican RepublicEastern AfricaEastern AsiaEastern EuropeEcuadorEgyptEl SalvadorEnglandEritreaEthiopiaEuropeFijiFranceGermanyGhanaGreeceGrenadaGuatemalaGuyanaHaitiHondurasHong KongHungaryIndiaIndonesiaIranIraqIrelandIsraelItalyJamaicaJapanJordanKazakhstanKenyaKoreaKuwaitLaosLatin AmericaLatviaLebanonLiberiaLithuaniaMalaysiaMexicoMicronesiaMiddle AfricaMoldovaMoroccoNepalNetherlandsNicaraguaNigeriaNorth AmericaNorth MacedoniaNorthern AfricaNorthern EuropeNorwayOceaniaPakistanPanamaPeruPhilippinesPolandPortugalRomaniaRussiaSaudi ArabiaScotlandSenegalSerbiaSierra LeoneSingaporeSomaliaSouth AfricaSouth AmericaSouth Central AsiaSouth Eastern AsiaSouthern EuropeSpainSri LankaSt. Vincent and the GrenadinesSudanSwedenSwitzerlandSyriaTaiwanThailandTrinidad and TobagoTurkeyUgandaUkraineUruguayUzbekistanVenezuelaVietnamWest IndiesWestern AfricaWestern AsiaWestern EuropeYemenZaireZimbabweAzores
Korean
Race
Ancestry
AfghanAfricanAlaska NativeAlaskan AthabascanAlbanianAleutAlsatianAmericanApacheArabArapahoArgentineanArmenianAssyrian/Chaldean/SyriacAustralianAustrianBahamianBangladeshiBarbadianBasqueBelgianBelizeanBermudanBhutaneseBlackfeetBolivianBrazilianBritishBritish West IndianBulgarianBurmeseCajunCambodianCanadianCape VerdeanCarpatho RusynCelticCentral AmericanCentral American IndianCherokeeCheyenneChickasawChileanChineseChippewaChoctawColombianColvilleComancheCosta RicanCreeCreekCroatianCrowCubanCypriotCzechCzechoslovakianDanishDelawareDominicanDutchDutch West IndianEastern EuropeanEcuadorianEgyptianEnglishEstonianEthiopianEuropeanFijianFilipinoFinnishFrenchFrench American IndianFrench CanadianGermanGerman RussianGhanaianGreekGuamanian/ChamorroGuatemalanGuyaneseHaitianHmongHonduranHopiHoumaHungarianIcelanderIndian (Asian)IndonesianInupiatIranianIraqiIrishIroquoisIsraeliItalianJamaicanJapaneseJordanianKenyanKiowaKoreanLaotianLatvianLebaneseLiberianLithuanianLumbeeLuxembourgerMacedonianMalaysianMalteseMarshalleseMenomineeMexicanMexican American IndianMongolianMoroccanNative HawaiianNavajoNepaleseNew ZealanderNicaraguanNigerianNorthern EuropeanNorwegianOkinawanOsageOttawaPaiutePakistaniPalestinianPanamanianParaguayanPennsylvania GermanPeruvianPimaPolishPortuguesePotawatomiPuebloPuerto RicanPuget Sound SalishRomanianRussianSalvadoranSamoanScandinavianScotch-IrishScottishSeminoleSenegaleseSerbianShoshoneSierra LeoneanSiouxSlavicSlovakSloveneSomaliSouth AfricanSouth AmericanSouth American IndianSoviet UnionSpaniardSpanishSpanish AmericanSpanish American IndianSri LankanSubsaharan AfricanSudaneseSwedishSwissSyrianTaiwaneseThaiTlingit-HaidaTohono O'OdhamTonganTrinidadian and TobagonianTsimshianTurkishU.S. Virgin IslanderUgandanUkrainianUruguayanUteVenezuelanVietnameseWelshWest IndianYakamaYaquiYugoslavianYumanYup'ikZimbabwean
Immigration
NonimmigrantsImmigrantsAfghanistanAfricaAlbaniaArgentinaArmeniaAsiaAustraliaAustriaBahamasBangladeshBarbadosBelarusBelgiumBelizeBoliviaBosnia and HerzegovinaBrazilBulgariaBurma/MyanmarCabo VerdeCambodiaCameroonCanadaCaribbeanCentral AmericaChileChinaColombiaCongoCosta RicaCroatiaCubaCzechoslovakiaDenmarkDominicaDominican RepublicEastern AfricaEastern AsiaEastern EuropeEcuadorEgyptEl SalvadorEnglandEritreaEthiopiaEuropeFijiFranceGermanyGhanaGreeceGrenadaGuatemalaGuyanaHaitiHondurasHong KongHungaryIndiaIndonesiaIranIraqIrelandIsraelItalyJamaicaJapanJordanKazakhstanKenyaKoreaKuwaitLaosLatin AmericaLatviaLebanonLiberiaLithuaniaMalaysiaMexicoMicronesiaMiddle AfricaMoldovaMoroccoNepalNetherlandsNicaraguaNigeriaNorth AmericaNorth MacedoniaNorthern AfricaNorthern EuropeNorwayOceaniaPakistanPanamaPeruPhilippinesPolandPortugalRomaniaRussiaSaudi ArabiaScotlandSenegalSerbiaSierra LeoneSingaporeSomaliaSouth AfricaSouth AmericaSouth Central AsiaSouth Eastern AsiaSpainSri LankaSt. Vincent and the GrenadinesSudanSwedenSwitzerlandSyriaTaiwanThailandTrinidad and TobagoTurkeyUgandaUkraineUruguayUzbekistanVenezuelaVietnamWest IndiesWestern AfricaWestern AsiaWestern EuropeYemenZaireZimbabweAzores
Births to Unmarried Women
Income
Poverty
Unemployment
Labor Participation
Family Structure
Vehicle Availability
Education Level
Disability

Births to Unmarried Women Comparison

Immigrants from Southern Europe

Koreans

Good
Excellent
31.1%
BIRTHS TO UNMARRIED WOMEN
68.7/ 100
METRIC RATING
161st/ 347
METRIC RANK
30.1%
BIRTHS TO UNMARRIED WOMEN
88.9/ 100
METRIC RATING
121st/ 347
METRIC RANK

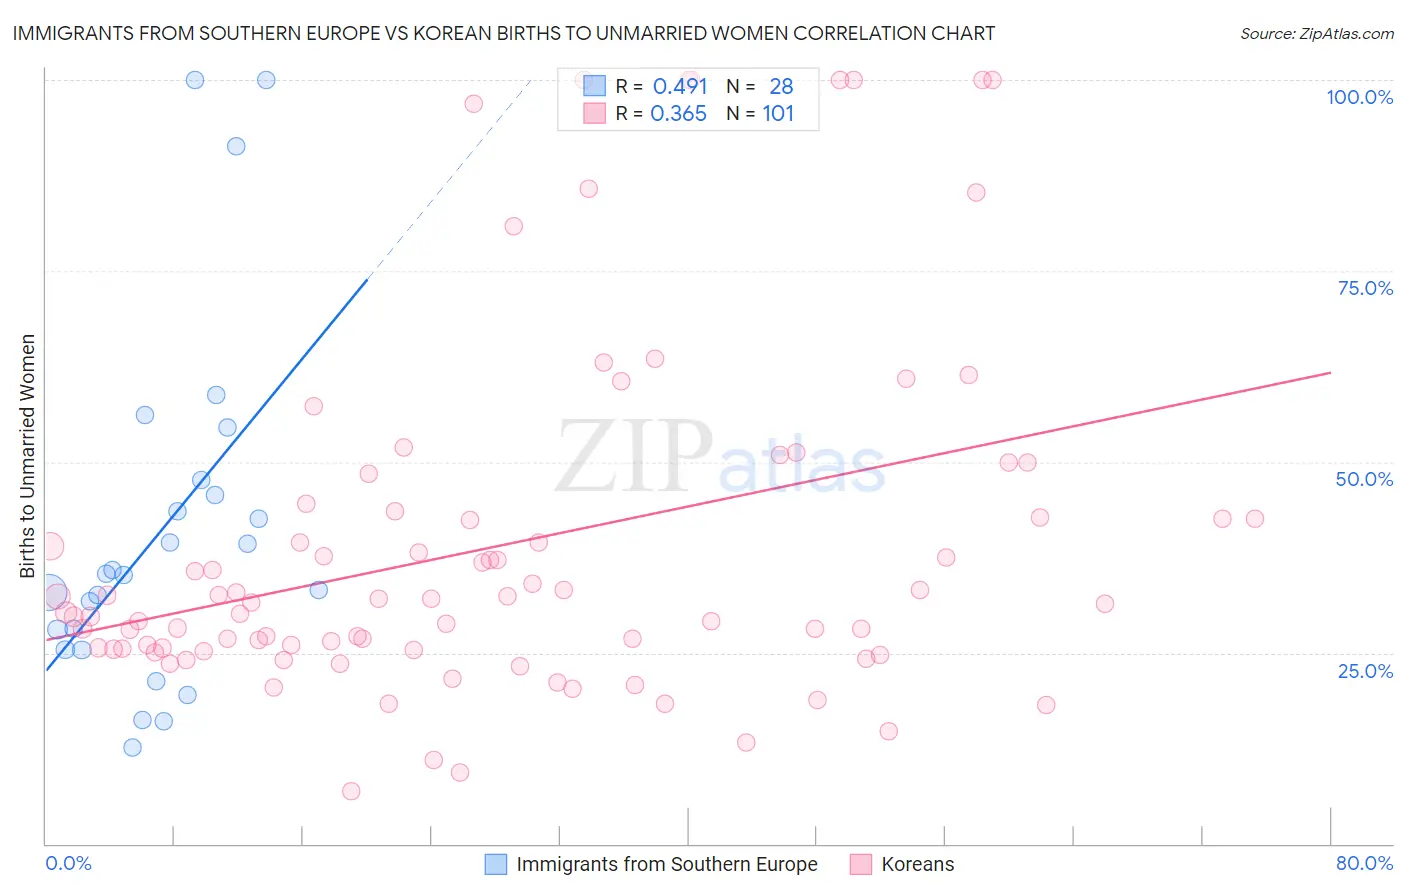
Immigrants from Southern Europe vs Korean Births to Unmarried Women Correlation Chart

The statistical analysis conducted on geographies consisting of 371,346,539 people shows a moderate positive correlation between the proportion of Immigrants from Southern Europe and percentage of births to unmarried women in the United States with a correlation coefficient (R) of 0.491 and weighted average of 31.1%. Similarly, the statistical analysis conducted on geographies consisting of 466,988,654 people shows a mild positive correlation between the proportion of Koreans and percentage of births to unmarried women in the United States with a correlation coefficient (R) of 0.365 and weighted average of 30.1%, a difference of 3.2%.
Immigrants from Southern Europe vs Korean Births to Unmarried Women

Births to Unmarried Women Correlation Summary

MeasurementImmigrants from Southern EuropeKorean
Minimum12.6%6.8%
Maximum100.0%100.0%
Range87.4%93.2%
Mean41.0%39.1%
Median35.3%31.5%
Interquartile 25% (IQ1)26.7%25.5%
Interquartile 75% (IQ3)46.6%43.1%
Interquartile Range (IQR)19.9%17.6%
Standard Deviation (Sample)23.1%22.9%
Standard Deviation (Population)22.7%22.8%

Similar Demographics by Births to Unmarried Women

Demographics Similar to Immigrants from Southern Europe by Births to Unmarried Women

In terms of births to unmarried women, the demographic groups most similar to Immigrants from Southern Europe are Immigrants from England (31.1%, a difference of 0.070%), Immigrants from Western Europe (31.1%, a difference of 0.070%), Austrian (31.0%, a difference of 0.13%), Slovene (31.2%, a difference of 0.31%), and Immigrants from Chile (31.2%, a difference of 0.33%).
DemographicsRating | RankBirths to Unmarried Women
Yugoslavians
75.1
/100
|
#154
Good
30.8%
Immigrants | Bangladesh
73.9
/100
|
#155
Good
30.9%
Carpatho Rusyns
73.5
/100
|
#156
Good
30.9%
Immigrants | Eastern Africa
72.1
/100
|
#157
Good
31.0%
Austrians
69.9
/100
|
#158
Good
31.0%
Immigrants | England
69.4
/100
|
#159
Good
31.1%
Immigrants | Western Europe
69.3
/100
|
#160
Good
31.1%
Immigrants | Southern Europe
68.7
/100
|
#161
Good
31.1%
Slovenes
65.9
/100
|
#162
Good
31.2%
Immigrants | Chile
65.7
/100
|
#163
Good
31.2%
Hungarians
64.1
/100
|
#164
Good
31.2%
Immigrants | Somalia
58.1
/100
|
#165
Average
31.4%
Peruvians
55.5
/100
|
#166
Average
31.5%
Dutch
55.3
/100
|
#167
Average
31.5%
Belgians
52.4
/100
|
#168
Average
31.6%

Demographics Similar to Koreans by Births to Unmarried Women

In terms of births to unmarried women, the demographic groups most similar to Koreans are Immigrants from Argentina (30.1%, a difference of 0.050%), Ugandan (30.1%, a difference of 0.070%), Syrian (30.2%, a difference of 0.18%), Croatian (30.2%, a difference of 0.21%), and Vietnamese (30.2%, a difference of 0.28%).
DemographicsRating | RankBirths to Unmarried Women
Immigrants | Croatia
92.6
/100
|
#114
Exceptional
29.8%
Ethiopians
91.9
/100
|
#115
Exceptional
29.8%
Immigrants | Italy
91.7
/100
|
#116
Exceptional
29.9%
Immigrants | Netherlands
91.1
/100
|
#117
Exceptional
29.9%
Immigrants | Norway
91.0
/100
|
#118
Exceptional
29.9%
Argentineans
90.5
/100
|
#119
Exceptional
30.0%
Ugandans
89.2
/100
|
#120
Excellent
30.1%
Koreans
88.9
/100
|
#121
Excellent
30.1%
Immigrants | Argentina
88.7
/100
|
#122
Excellent
30.1%
Syrians
88.2
/100
|
#123
Excellent
30.2%
Croatians
88.0
/100
|
#124
Excellent
30.2%
Vietnamese
87.7
/100
|
#125
Excellent
30.2%
Europeans
87.2
/100
|
#126
Excellent
30.2%
Chinese
87.1
/100
|
#127
Excellent
30.2%
Icelanders
86.0
/100
|
#128
Excellent
30.3%