Immigrants from South Central Asia vs Immigrants from South Africa Divorced or Separated
COMPARE
Immigrants from South Central Asia
Immigrants from South Africa
Divorced or Separated
Divorced or Separated Comparison
Immigrants from South Central Asia
Immigrants from South Africa
10.4%
DIVORCED OR SEPARATED
100.0/ 100
METRIC RATING
11th/ 347
METRIC RANK
11.7%
DIVORCED OR SEPARATED
96.9/ 100
METRIC RATING
109th/ 347
METRIC RANK
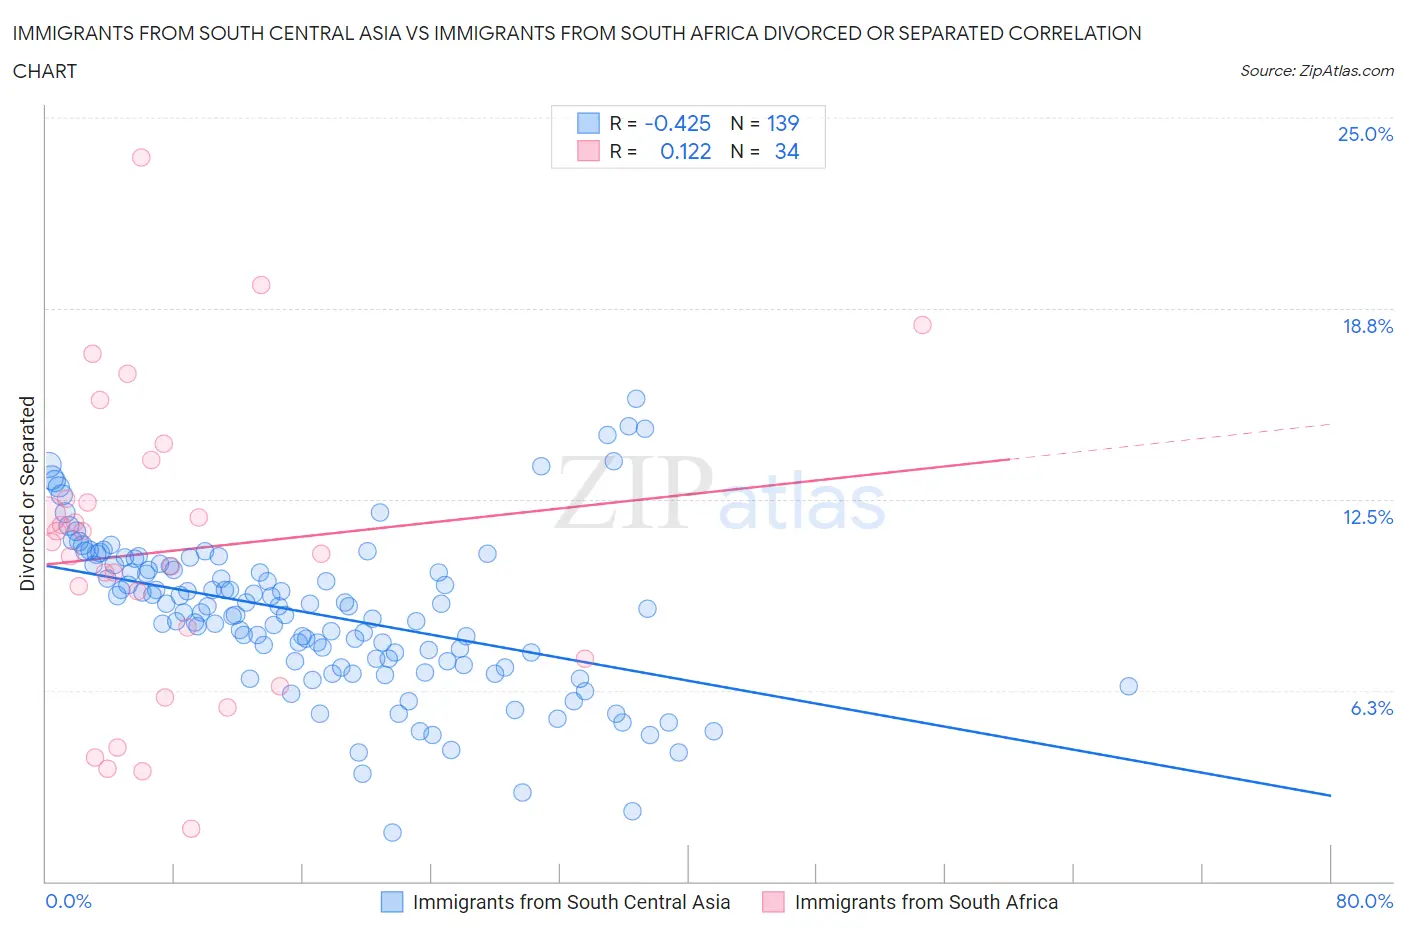
Immigrants from South Central Asia vs Immigrants from South Africa Divorced or Separated Correlation Chart
The statistical analysis conducted on geographies consisting of 472,795,215 people shows a moderate negative correlation between the proportion of Immigrants from South Central Asia and percentage of population currently divorced or separated in the United States with a correlation coefficient (R) of -0.425 and weighted average of 10.4%. Similarly, the statistical analysis conducted on geographies consisting of 233,280,296 people shows a poor positive correlation between the proportion of Immigrants from South Africa and percentage of population currently divorced or separated in the United States with a correlation coefficient (R) of 0.122 and weighted average of 11.7%, a difference of 12.1%.
Divorced or Separated Correlation Summary
| Measurement | Immigrants from South Central Asia | Immigrants from South Africa |
| Minimum | 1.6% | 1.7% |
| Maximum | 15.8% | 23.7% |
| Range | 14.2% | 22.0% |
| Mean | 8.8% | 10.8% |
| Median | 8.9% | 10.9% |
| Interquartile 25% (IQ1) | 7.2% | 7.3% |
| Interquartile 75% (IQ3) | 10.3% | 12.5% |
| Interquartile Range (IQR) | 3.2% | 5.2% |
| Standard Deviation (Sample) | 2.6% | 4.9% |
| Standard Deviation (Population) | 2.6% | 4.8% |
Similar Demographics by Divorced or Separated
Demographics Similar to Immigrants from South Central Asia by Divorced or Separated
In terms of divorced or separated, the demographic groups most similar to Immigrants from South Central Asia are Okinawan (10.5%, a difference of 0.34%), Cypriot (10.5%, a difference of 0.49%), Immigrants from Singapore (10.3%, a difference of 0.91%), Assyrian/Chaldean/Syriac (10.6%, a difference of 1.2%), and Immigrants from Armenia (10.6%, a difference of 1.3%).
| Demographics | Rating | Rank | Divorced or Separated |
| Immigrants | China | 100.0 /100 | #4 | Exceptional 10.0% |
| Immigrants | India | 100.0 /100 | #5 | Exceptional 10.1% |
| Indians (Asian) | 100.0 /100 | #6 | Exceptional 10.2% |
| Thais | 100.0 /100 | #7 | Exceptional 10.2% |
| Immigrants | Eastern Asia | 100.0 /100 | #8 | Exceptional 10.2% |
| Yup'ik | 100.0 /100 | #9 | Exceptional 10.3% |
| Immigrants | Singapore | 100.0 /100 | #10 | Exceptional 10.3% |
| Immigrants | South Central Asia | 100.0 /100 | #11 | Exceptional 10.4% |
| Okinawans | 100.0 /100 | #12 | Exceptional 10.5% |
| Cypriots | 100.0 /100 | #13 | Exceptional 10.5% |
| Assyrians/Chaldeans/Syriacs | 100.0 /100 | #14 | Exceptional 10.6% |
| Immigrants | Armenia | 100.0 /100 | #15 | Exceptional 10.6% |
| Immigrants | Korea | 100.0 /100 | #16 | Exceptional 10.6% |
| Immigrants | Israel | 100.0 /100 | #17 | Exceptional 10.6% |
| Immigrants | Iran | 100.0 /100 | #18 | Exceptional 10.6% |
Demographics Similar to Immigrants from South Africa by Divorced or Separated
In terms of divorced or separated, the demographic groups most similar to Immigrants from South Africa are Immigrants from Czechoslovakia (11.7%, a difference of 0.0%), Greek (11.7%, a difference of 0.010%), Immigrants from Spain (11.7%, a difference of 0.040%), Immigrants from France (11.7%, a difference of 0.090%), and Estonian (11.7%, a difference of 0.090%).
| Demographics | Rating | Rank | Divorced or Separated |
| Immigrants | Croatia | 98.3 /100 | #102 | Exceptional 11.6% |
| Maltese | 98.2 /100 | #103 | Exceptional 11.6% |
| Salvadorans | 98.2 /100 | #104 | Exceptional 11.6% |
| Immigrants | El Salvador | 97.9 /100 | #105 | Exceptional 11.7% |
| Immigrants | Kazakhstan | 97.8 /100 | #106 | Exceptional 11.7% |
| Native Hawaiians | 97.2 /100 | #107 | Exceptional 11.7% |
| Greeks | 96.9 /100 | #108 | Exceptional 11.7% |
| Immigrants | South Africa | 96.9 /100 | #109 | Exceptional 11.7% |
| Immigrants | Czechoslovakia | 96.9 /100 | #110 | Exceptional 11.7% |
| Immigrants | Spain | 96.8 /100 | #111 | Exceptional 11.7% |
| Immigrants | France | 96.6 /100 | #112 | Exceptional 11.7% |
| Estonians | 96.6 /100 | #113 | Exceptional 11.7% |
| Immigrants | Norway | 95.9 /100 | #114 | Exceptional 11.7% |
| Lithuanians | 95.7 /100 | #115 | Exceptional 11.7% |
| Immigrants | Iraq | 95.4 /100 | #116 | Exceptional 11.7% |