Immigrants from South America vs Immigrants from Sweden Single Father Households
COMPARE
Immigrants from South America
Immigrants from Sweden
Single Father Households
Single Father Households Comparison
Immigrants from South America
Immigrants from Sweden
2.3%
SINGLE FATHER HOUSEHOLDS
79.9/ 100
METRIC RATING
156th/ 347
METRIC RANK
2.1%
SINGLE FATHER HOUSEHOLDS
99.8/ 100
METRIC RATING
75th/ 347
METRIC RANK
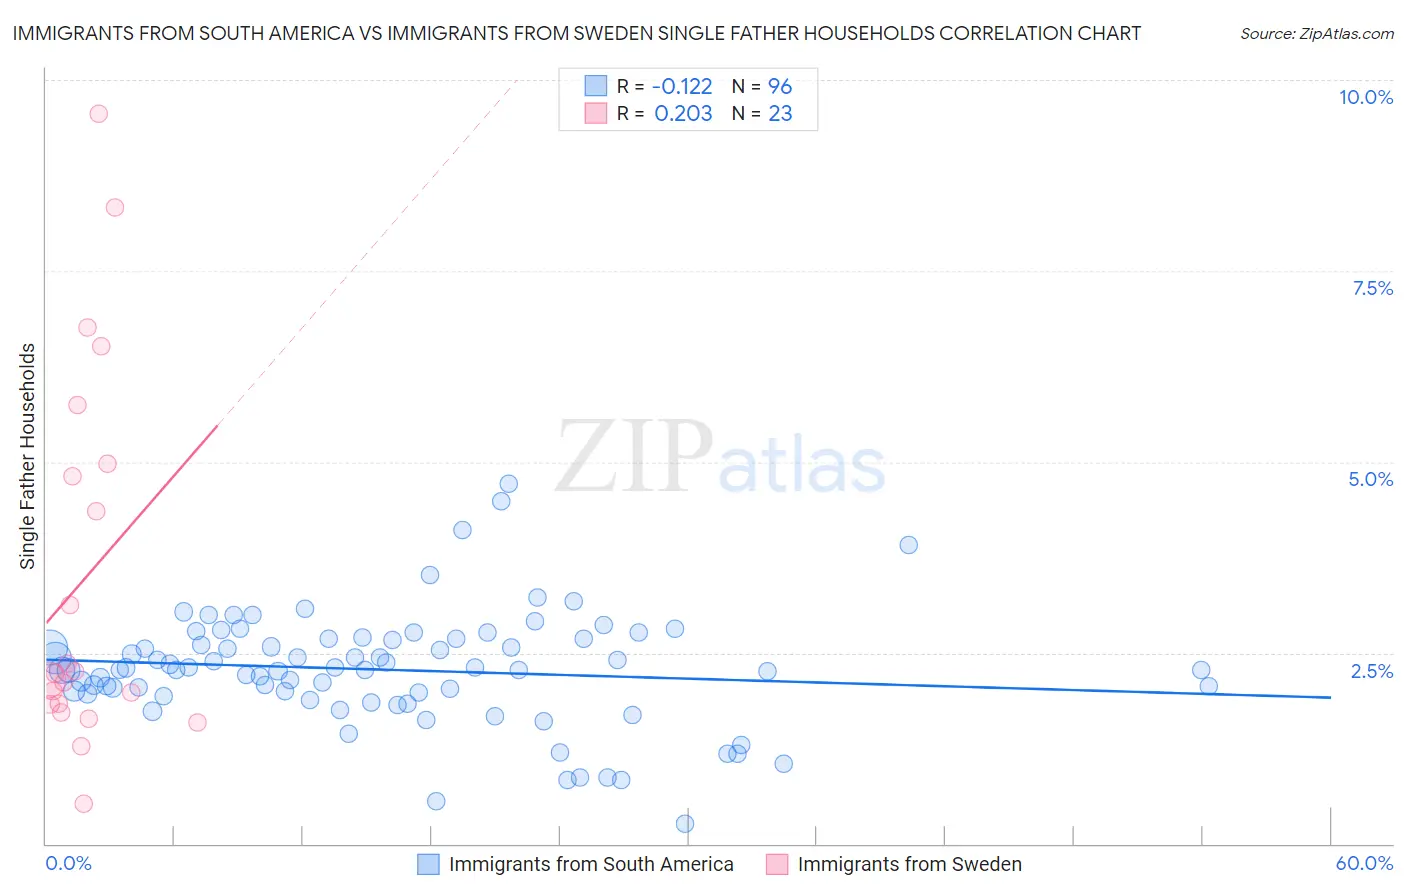
Immigrants from South America vs Immigrants from Sweden Single Father Households Correlation Chart
The statistical analysis conducted on geographies consisting of 479,744,076 people shows a poor negative correlation between the proportion of Immigrants from South America and percentage of single father households in the United States with a correlation coefficient (R) of -0.122 and weighted average of 2.3%. Similarly, the statistical analysis conducted on geographies consisting of 163,814,795 people shows a weak positive correlation between the proportion of Immigrants from Sweden and percentage of single father households in the United States with a correlation coefficient (R) of 0.203 and weighted average of 2.1%, a difference of 9.7%.
Single Father Households Correlation Summary
| Measurement | Immigrants from South America | Immigrants from Sweden |
| Minimum | 0.26% | 0.53% |
| Maximum | 4.7% | 9.6% |
| Range | 4.5% | 9.0% |
| Mean | 2.3% | 3.5% |
| Median | 2.3% | 2.2% |
| Interquartile 25% (IQ1) | 2.0% | 1.8% |
| Interquartile 75% (IQ3) | 2.7% | 5.0% |
| Interquartile Range (IQR) | 0.71% | 3.1% |
| Standard Deviation (Sample) | 0.75% | 2.4% |
| Standard Deviation (Population) | 0.74% | 2.4% |
Similar Demographics by Single Father Households
Demographics Similar to Immigrants from South America by Single Father Households
In terms of single father households, the demographic groups most similar to Immigrants from South America are Canadian (2.3%, a difference of 0.020%), Immigrants from Senegal (2.3%, a difference of 0.050%), European (2.3%, a difference of 0.12%), Bolivian (2.3%, a difference of 0.14%), and Immigrants from West Indies (2.3%, a difference of 0.22%).
| Demographics | Rating | Rank | Single Father Households |
| Senegalese | 88.4 /100 | #149 | Excellent 2.3% |
| Venezuelans | 86.2 /100 | #150 | Excellent 2.3% |
| Immigrants | Syria | 84.8 /100 | #151 | Excellent 2.3% |
| Immigrants | Venezuela | 83.2 /100 | #152 | Excellent 2.3% |
| Immigrants | Germany | 82.8 /100 | #153 | Excellent 2.3% |
| Bolivians | 81.0 /100 | #154 | Excellent 2.3% |
| Europeans | 80.9 /100 | #155 | Excellent 2.3% |
| Immigrants | South America | 79.9 /100 | #156 | Good 2.3% |
| Canadians | 79.7 /100 | #157 | Good 2.3% |
| Immigrants | Senegal | 79.4 /100 | #158 | Good 2.3% |
| Immigrants | West Indies | 77.9 /100 | #159 | Good 2.3% |
| Immigrants | Bolivia | 76.3 /100 | #160 | Good 2.3% |
| Swiss | 73.2 /100 | #161 | Good 2.3% |
| Scottish | 72.8 /100 | #162 | Good 2.3% |
| Irish | 72.1 /100 | #163 | Good 2.3% |
Demographics Similar to Immigrants from Sweden by Single Father Households
In terms of single father households, the demographic groups most similar to Immigrants from Sweden are Immigrants from Scotland (2.1%, a difference of 0.010%), Immigrants from Saudi Arabia (2.1%, a difference of 0.040%), Immigrants from Egypt (2.1%, a difference of 0.28%), Immigrants from Bangladesh (2.1%, a difference of 0.29%), and Estonian (2.1%, a difference of 0.35%).
| Demographics | Rating | Rank | Single Father Households |
| Immigrants | Denmark | 99.8 /100 | #68 | Exceptional 2.1% |
| Immigrants | Romania | 99.8 /100 | #69 | Exceptional 2.1% |
| Egyptians | 99.8 /100 | #70 | Exceptional 2.1% |
| Immigrants | Kuwait | 99.8 /100 | #71 | Exceptional 2.1% |
| Immigrants | Spain | 99.8 /100 | #72 | Exceptional 2.1% |
| Immigrants | Bangladesh | 99.8 /100 | #73 | Exceptional 2.1% |
| Immigrants | Egypt | 99.8 /100 | #74 | Exceptional 2.1% |
| Immigrants | Sweden | 99.8 /100 | #75 | Exceptional 2.1% |
| Immigrants | Scotland | 99.8 /100 | #76 | Exceptional 2.1% |
| Immigrants | Saudi Arabia | 99.8 /100 | #77 | Exceptional 2.1% |
| Estonians | 99.7 /100 | #78 | Exceptional 2.1% |
| Immigrants | Asia | 99.7 /100 | #79 | Exceptional 2.1% |
| Immigrants | South Africa | 99.7 /100 | #80 | Exceptional 2.1% |
| Armenians | 99.7 /100 | #81 | Exceptional 2.1% |
| New Zealanders | 99.7 /100 | #82 | Exceptional 2.1% |