Immigrants from Somalia vs Samoan Family Households with Children

COMPARE

Immigrants from Somalia
Race
Ancestry
AfghanAfricanAlaska NativeAlaskan AthabascanAlbanianAleutAlsatianAmericanApacheArabArapahoArgentineanArmenianAssyrian/Chaldean/SyriacAustralianAustrianBahamianBangladeshiBarbadianBasqueBelgianBelizeanBermudanBhutaneseBlackfeetBolivianBrazilianBritishBritish West IndianBulgarianBurmeseCajunCambodianCanadianCape VerdeanCarpatho RusynCelticCentral AmericanCentral American IndianCherokeeCheyenneChickasawChileanChineseChippewaChoctawColombianColvilleComancheCosta RicanCreeCreekCroatianCrowCubanCypriotCzechCzechoslovakianDanishDelawareDominicanDutchDutch West IndianEastern EuropeanEcuadorianEgyptianEnglishEstonianEthiopianEuropeanFijianFilipinoFinnishFrenchFrench American IndianFrench CanadianGermanGerman RussianGhanaianGreekGuamanian/ChamorroGuatemalanGuyaneseHaitianHmongHonduranHopiHoumaHungarianIcelanderIndian (Asian)IndonesianInupiatIranianIraqiIrishIroquoisIsraeliItalianJamaicanJapaneseJordanianKenyanKiowaKoreanLaotianLatvianLebaneseLiberianLithuanianLumbeeLuxembourgerMacedonianMalaysianMalteseMarshalleseMenomineeMexicanMexican American IndianMongolianMoroccanNative HawaiianNavajoNepaleseNew ZealanderNicaraguanNigerianNorthern EuropeanNorwegianOkinawanOsageOttawaPaiutePakistaniPalestinianPanamanianParaguayanPennsylvania GermanPeruvianPimaPolishPortuguesePotawatomiPuebloPuerto RicanPuget Sound SalishRomanianRussianSalvadoranScandinavianScotch-IrishScottishSeminoleSenegaleseSerbianShoshoneSierra LeoneanSiouxSlavicSlovakSloveneSomaliSouth AfricanSouth AmericanSouth American IndianSoviet UnionSpaniardSpanishSpanish AmericanSpanish American IndianSri LankanSubsaharan AfricanSudaneseSwedishSwissSyrianTaiwaneseThaiTlingit-HaidaTohono O'OdhamTonganTrinidadian and TobagonianTsimshianTurkishU.S. Virgin IslanderUgandanUkrainianUruguayanUteVenezuelanVietnameseWelshWest IndianYakamaYaquiYugoslavianYumanYup'ikZimbabwean
Immigration
NonimmigrantsImmigrantsAfghanistanAfricaAlbaniaArgentinaArmeniaAsiaAustraliaAustriaBahamasBangladeshBarbadosBelarusBelgiumBelizeBoliviaBosnia and HerzegovinaBrazilBulgariaBurma/MyanmarCabo VerdeCambodiaCameroonCanadaCaribbeanCentral AmericaChileChinaColombiaCongoCosta RicaCroatiaCubaCzechoslovakiaDenmarkDominicaDominican RepublicEastern AfricaEastern AsiaEastern EuropeEcuadorEgyptEl SalvadorEnglandEritreaEthiopiaEuropeFijiFranceGermanyGhanaGreeceGrenadaGuatemalaGuyanaHaitiHondurasHong KongHungaryIndiaIndonesiaIranIraqIrelandIsraelItalyJamaicaJapanJordanKazakhstanKenyaKoreaKuwaitLaosLatin AmericaLatviaLebanonLiberiaLithuaniaMalaysiaMexicoMicronesiaMiddle AfricaMoldovaMoroccoNepalNetherlandsNicaraguaNigeriaNorth AmericaNorth MacedoniaNorthern AfricaNorthern EuropeNorwayOceaniaPakistanPanamaPeruPhilippinesPolandPortugalRomaniaRussiaSaudi ArabiaScotlandSenegalSerbiaSierra LeoneSingaporeSomaliaSouth AfricaSouth AmericaSouth Central AsiaSouth Eastern AsiaSouthern EuropeSpainSri LankaSt. Vincent and the GrenadinesSudanSwedenSwitzerlandSyriaTaiwanThailandTrinidad and TobagoTurkeyUgandaUkraineUruguayUzbekistanVenezuelaVietnamWest IndiesWestern AfricaWestern AsiaWestern EuropeYemenZaireZimbabweAzores
Samoan
Race
Ancestry
AfghanAfricanAlaska NativeAlaskan AthabascanAlbanianAleutAlsatianAmericanApacheArabArapahoArgentineanArmenianAssyrian/Chaldean/SyriacAustralianAustrianBahamianBangladeshiBarbadianBasqueBelgianBelizeanBermudanBhutaneseBlackfeetBolivianBrazilianBritishBritish West IndianBulgarianBurmeseCajunCambodianCanadianCape VerdeanCarpatho RusynCelticCentral AmericanCentral American IndianCherokeeCheyenneChickasawChileanChineseChippewaChoctawColombianColvilleComancheCosta RicanCreeCreekCroatianCrowCubanCypriotCzechCzechoslovakianDanishDelawareDominicanDutchDutch West IndianEastern EuropeanEcuadorianEgyptianEnglishEstonianEthiopianEuropeanFijianFilipinoFinnishFrenchFrench American IndianFrench CanadianGermanGerman RussianGhanaianGreekGuamanian/ChamorroGuatemalanGuyaneseHaitianHmongHonduranHopiHoumaHungarianIcelanderIndian (Asian)IndonesianInupiatIranianIraqiIrishIroquoisIsraeliItalianJamaicanJapaneseJordanianKenyanKiowaKoreanLaotianLatvianLebaneseLiberianLithuanianLumbeeLuxembourgerMacedonianMalaysianMalteseMarshalleseMenomineeMexicanMexican American IndianMongolianMoroccanNative HawaiianNavajoNepaleseNew ZealanderNicaraguanNigerianNorthern EuropeanNorwegianOkinawanOsageOttawaPaiutePakistaniPalestinianPanamanianParaguayanPennsylvania GermanPeruvianPimaPolishPortuguesePotawatomiPuebloPuerto RicanPuget Sound SalishRomanianRussianSalvadoranSamoanScandinavianScotch-IrishScottishSeminoleSenegaleseSerbianShoshoneSierra LeoneanSiouxSlavicSlovakSloveneSomaliSouth AfricanSouth AmericanSouth American IndianSoviet UnionSpaniardSpanishSpanish AmericanSpanish American IndianSri LankanSubsaharan AfricanSudaneseSwedishSwissSyrianTaiwaneseThaiTlingit-HaidaTohono O'OdhamTonganTrinidadian and TobagonianTsimshianTurkishU.S. Virgin IslanderUgandanUkrainianUruguayanUteVenezuelanVietnameseWelshWest IndianYakamaYaquiYugoslavianYumanYup'ikZimbabwean
Immigration
NonimmigrantsImmigrantsAfghanistanAfricaAlbaniaArgentinaArmeniaAsiaAustraliaAustriaBahamasBangladeshBarbadosBelarusBelgiumBelizeBoliviaBosnia and HerzegovinaBrazilBulgariaBurma/MyanmarCabo VerdeCambodiaCameroonCanadaCaribbeanCentral AmericaChileChinaColombiaCongoCosta RicaCroatiaCubaCzechoslovakiaDenmarkDominicaDominican RepublicEastern AfricaEastern AsiaEastern EuropeEcuadorEgyptEl SalvadorEnglandEritreaEthiopiaEuropeFijiFranceGermanyGhanaGreeceGrenadaGuatemalaGuyanaHaitiHondurasHong KongHungaryIndiaIndonesiaIranIraqIrelandIsraelItalyJamaicaJapanJordanKazakhstanKenyaKoreaKuwaitLaosLatin AmericaLatviaLebanonLiberiaLithuaniaMalaysiaMexicoMicronesiaMiddle AfricaMoldovaMoroccoNepalNetherlandsNicaraguaNigeriaNorth AmericaNorth MacedoniaNorthern AfricaNorthern EuropeNorwayOceaniaPakistanPanamaPeruPhilippinesPolandPortugalRomaniaRussiaSaudi ArabiaScotlandSenegalSerbiaSierra LeoneSingaporeSouth AfricaSouth AmericaSouth Central AsiaSouth Eastern AsiaSouthern EuropeSpainSri LankaSt. Vincent and the GrenadinesSudanSwedenSwitzerlandSyriaTaiwanThailandTrinidad and TobagoTurkeyUgandaUkraineUruguayUzbekistanVenezuelaVietnamWest IndiesWestern AfricaWestern AsiaWestern EuropeYemenZaireZimbabweAzores
Family Households with Children
Income
Poverty
Unemployment
Labor Participation
Family Structure
Vehicle Availability
Education Level
Disability

Family Households with Children Comparison

Immigrants from Somalia

Samoans

Tragic
Exceptional
26.3%
FAMILY HOUSEHOLDS WITH CHILDREN
0.0/ 100
METRIC RATING
309th/ 347
METRIC RANK
29.5%
FAMILY HOUSEHOLDS WITH CHILDREN
100.0/ 100
METRIC RATING
28th/ 347
METRIC RANK

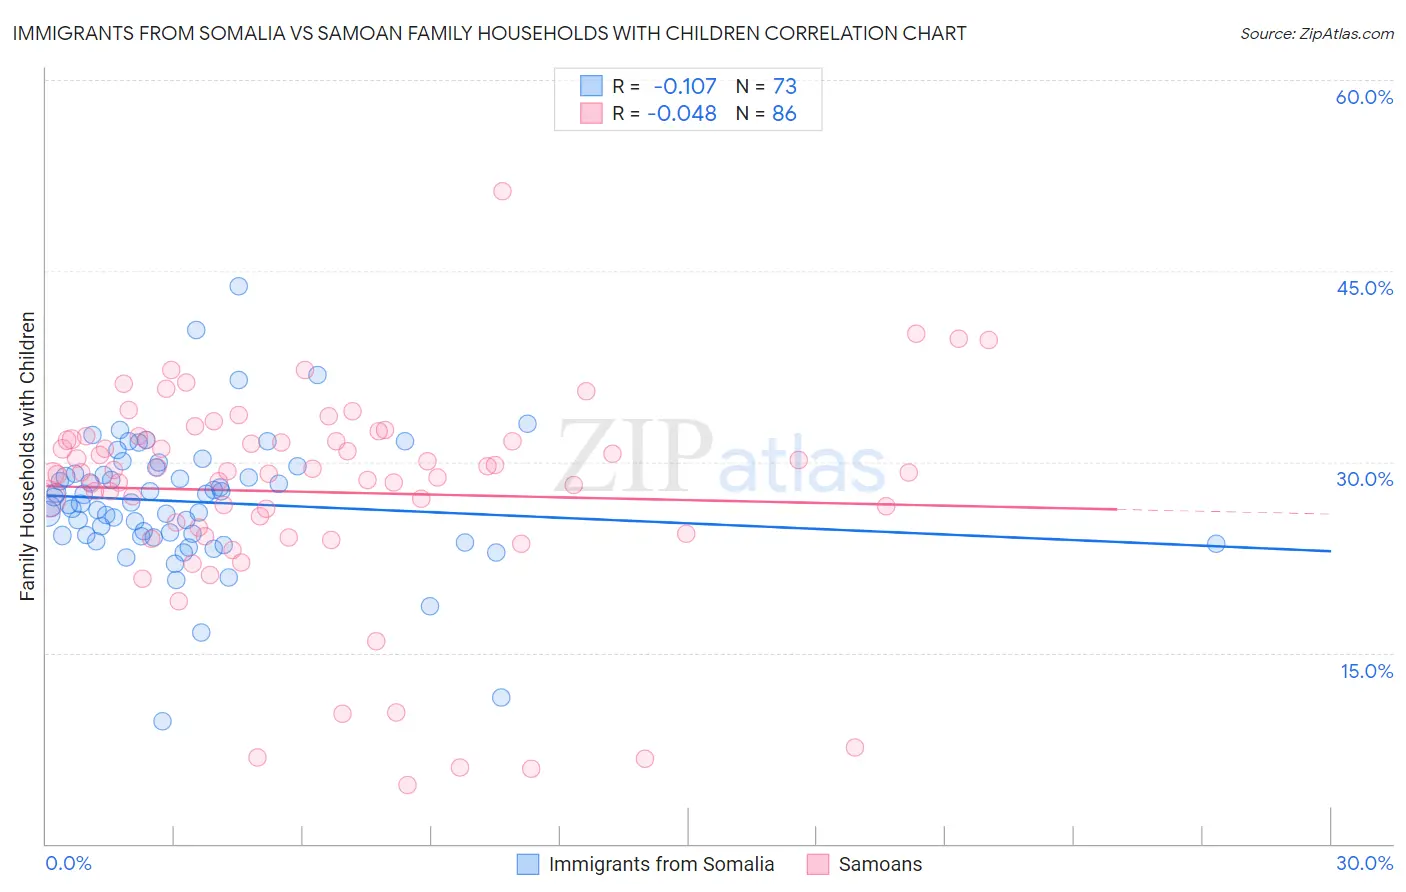
Immigrants from Somalia vs Samoan Family Households with Children Correlation Chart

The statistical analysis conducted on geographies consisting of 92,093,079 people shows a poor negative correlation between the proportion of Immigrants from Somalia and percentage of family households with children in the United States with a correlation coefficient (R) of -0.107 and weighted average of 26.3%. Similarly, the statistical analysis conducted on geographies consisting of 225,025,987 people shows no correlation between the proportion of Samoans and percentage of family households with children in the United States with a correlation coefficient (R) of -0.048 and weighted average of 29.5%, a difference of 12.3%.
Immigrants from Somalia vs Samoan Family Households with Children

Family Households with Children Correlation Summary

MeasurementImmigrants from SomaliaSamoan
Minimum9.6%4.6%
Maximum43.8%51.3%
Range34.2%46.7%
Mean26.9%27.6%
Median26.7%29.2%
Interquartile 25% (IQ1)24.2%24.8%
Interquartile 75% (IQ3)29.3%31.8%
Interquartile Range (IQR)5.1%6.9%
Standard Deviation (Sample)5.2%8.3%
Standard Deviation (Population)5.2%8.2%

Similar Demographics by Family Households with Children

Demographics Similar to Immigrants from Somalia by Family Households with Children

In terms of family households with children, the demographic groups most similar to Immigrants from Somalia are Marshallese (26.2%, a difference of 0.050%), Colville (26.2%, a difference of 0.090%), Lumbee (26.3%, a difference of 0.11%), West Indian (26.3%, a difference of 0.13%), and Immigrants from Czechoslovakia (26.2%, a difference of 0.16%).
DemographicsRating | RankFamily Households with Children
Serbians
0.1
/100
|
#302
Tragic
26.4%
Immigrants | Guyana
0.1
/100
|
#303
Tragic
26.3%
Immigrants | Bahamas
0.1
/100
|
#304
Tragic
26.3%
Guyanese
0.1
/100
|
#305
Tragic
26.3%
Bermudans
0.1
/100
|
#306
Tragic
26.3%
West Indians
0.0
/100
|
#307
Tragic
26.3%
Lumbee
0.0
/100
|
#308
Tragic
26.3%
Immigrants | Somalia
0.0
/100
|
#309
Tragic
26.3%
Marshallese
0.0
/100
|
#310
Tragic
26.2%
Colville
0.0
/100
|
#311
Tragic
26.2%
Immigrants | Czechoslovakia
0.0
/100
|
#312
Tragic
26.2%
Cree
0.0
/100
|
#313
Tragic
26.2%
French Canadians
0.0
/100
|
#314
Tragic
26.1%
Immigrants | Norway
0.0
/100
|
#315
Tragic
26.1%
Estonians
0.0
/100
|
#316
Tragic
26.1%

Demographics Similar to Samoans by Family Households with Children

In terms of family households with children, the demographic groups most similar to Samoans are Bolivian (29.5%, a difference of 0.0%), Yuman (29.5%, a difference of 0.040%), Immigrants from Vietnam (29.5%, a difference of 0.16%), Sri Lankan (29.5%, a difference of 0.18%), and Japanese (29.4%, a difference of 0.18%).
DemographicsRating | RankFamily Households with Children
Immigrants | Laos
100.0
/100
|
#21
Exceptional
29.8%
Malaysians
100.0
/100
|
#22
Exceptional
29.8%
Mexican American Indians
100.0
/100
|
#23
Exceptional
29.7%
Guamanians/Chamorros
100.0
/100
|
#24
Exceptional
29.7%
Immigrants | Latin America
100.0
/100
|
#25
Exceptional
29.7%
Sri Lankans
100.0
/100
|
#26
Exceptional
29.5%
Immigrants | Vietnam
100.0
/100
|
#27
Exceptional
29.5%
Samoans
100.0
/100
|
#28
Exceptional
29.5%
Bolivians
100.0
/100
|
#29
Exceptional
29.5%
Yuman
100.0
/100
|
#30
Exceptional
29.5%
Japanese
100.0
/100
|
#31
Exceptional
29.4%
Immigrants | Yemen
100.0
/100
|
#32
Exceptional
29.4%
Venezuelans
100.0
/100
|
#33
Exceptional
29.4%
Immigrants | Bolivia
100.0
/100
|
#34
Exceptional
29.3%
Immigrants | Sierra Leone
100.0
/100
|
#35
Exceptional
29.3%