Immigrants from Singapore vs Immigrants from Belize Births to Unmarried Women
COMPARE
Immigrants from Singapore
Immigrants from Belize
Births to Unmarried Women
Births to Unmarried Women Comparison
Immigrants from Singapore
Immigrants from Belize
25.6%
BIRTHS TO UNMARRIED WOMEN
100.0/ 100
METRIC RATING
15th/ 347
METRIC RANK
37.3%
BIRTHS TO UNMARRIED WOMEN
0.1/ 100
METRIC RATING
281st/ 347
METRIC RANK
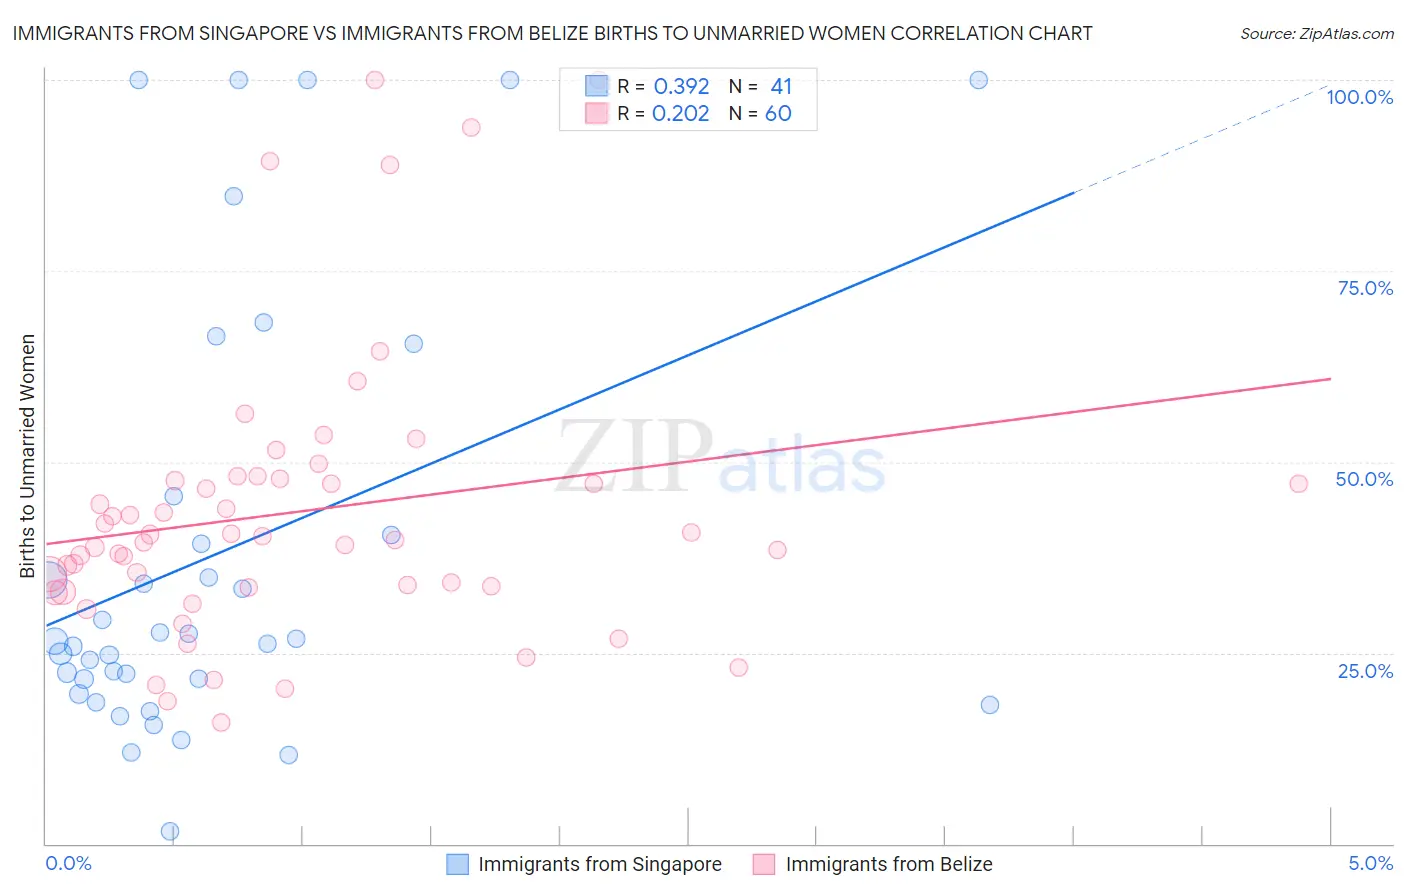
Immigrants from Singapore vs Immigrants from Belize Births to Unmarried Women Correlation Chart
The statistical analysis conducted on geographies consisting of 131,320,191 people shows a mild positive correlation between the proportion of Immigrants from Singapore and percentage of births to unmarried women in the United States with a correlation coefficient (R) of 0.392 and weighted average of 25.6%. Similarly, the statistical analysis conducted on geographies consisting of 128,168,479 people shows a weak positive correlation between the proportion of Immigrants from Belize and percentage of births to unmarried women in the United States with a correlation coefficient (R) of 0.202 and weighted average of 37.3%, a difference of 45.6%.
Births to Unmarried Women Correlation Summary
| Measurement | Immigrants from Singapore | Immigrants from Belize |
| Minimum | 1.7% | 15.8% |
| Maximum | 100.0% | 100.0% |
| Range | 98.3% | 84.2% |
| Mean | 38.2% | 43.4% |
| Median | 26.5% | 40.0% |
| Interquartile 25% (IQ1) | 20.6% | 33.6% |
| Interquartile 75% (IQ3) | 43.0% | 47.7% |
| Interquartile Range (IQR) | 22.4% | 14.0% |
| Standard Deviation (Sample) | 28.5% | 18.5% |
| Standard Deviation (Population) | 28.1% | 18.4% |
Similar Demographics by Births to Unmarried Women
Demographics Similar to Immigrants from Singapore by Births to Unmarried Women
In terms of births to unmarried women, the demographic groups most similar to Immigrants from Singapore are Immigrants from Belarus (25.6%, a difference of 0.050%), Immigrants from Uzbekistan (25.8%, a difference of 0.62%), Immigrants from Lebanon (25.3%, a difference of 1.2%), Iranian (25.3%, a difference of 1.3%), and Indian (Asian) (25.3%, a difference of 1.4%).
| Demographics | Rating | Rank | Births to Unmarried Women |
| Immigrants | China | 100.0 /100 | #8 | Exceptional 24.7% |
| Immigrants | South Central Asia | 100.0 /100 | #9 | Exceptional 24.7% |
| Immigrants | Eastern Asia | 100.0 /100 | #10 | Exceptional 25.0% |
| Immigrants | Israel | 100.0 /100 | #11 | Exceptional 25.1% |
| Indians (Asian) | 100.0 /100 | #12 | Exceptional 25.3% |
| Iranians | 100.0 /100 | #13 | Exceptional 25.3% |
| Immigrants | Lebanon | 100.0 /100 | #14 | Exceptional 25.3% |
| Immigrants | Singapore | 100.0 /100 | #15 | Exceptional 25.6% |
| Immigrants | Belarus | 100.0 /100 | #16 | Exceptional 25.6% |
| Immigrants | Uzbekistan | 100.0 /100 | #17 | Exceptional 25.8% |
| Immigrants | Armenia | 99.9 /100 | #18 | Exceptional 26.1% |
| Armenians | 99.9 /100 | #19 | Exceptional 26.2% |
| Immigrants | Korea | 99.9 /100 | #20 | Exceptional 26.3% |
| Soviet Union | 99.9 /100 | #21 | Exceptional 26.3% |
| Burmese | 99.9 /100 | #22 | Exceptional 26.4% |
Demographics Similar to Immigrants from Belize by Births to Unmarried Women
In terms of births to unmarried women, the demographic groups most similar to Immigrants from Belize are Immigrants from St. Vincent and the Grenadines (37.3%, a difference of 0.020%), West Indian (37.3%, a difference of 0.13%), Liberian (37.4%, a difference of 0.17%), Spanish American Indian (37.4%, a difference of 0.25%), and Immigrants from Central America (37.4%, a difference of 0.31%).
| Demographics | Rating | Rank | Births to Unmarried Women |
| Cree | 0.1 /100 | #274 | Tragic 37.0% |
| Barbadians | 0.1 /100 | #275 | Tragic 37.0% |
| Belizeans | 0.1 /100 | #276 | Tragic 37.0% |
| Guatemalans | 0.1 /100 | #277 | Tragic 37.1% |
| Immigrants | Latin America | 0.1 /100 | #278 | Tragic 37.1% |
| West Indians | 0.1 /100 | #279 | Tragic 37.3% |
| Immigrants | St. Vincent and the Grenadines | 0.1 /100 | #280 | Tragic 37.3% |
| Immigrants | Belize | 0.1 /100 | #281 | Tragic 37.3% |
| Liberians | 0.0 /100 | #282 | Tragic 37.4% |
| Spanish American Indians | 0.0 /100 | #283 | Tragic 37.4% |
| Immigrants | Central America | 0.0 /100 | #284 | Tragic 37.4% |
| Immigrants | Mexico | 0.0 /100 | #285 | Tragic 37.5% |
| Immigrants | Guatemala | 0.0 /100 | #286 | Tragic 37.5% |
| Creek | 0.0 /100 | #287 | Tragic 37.6% |
| Immigrants | Liberia | 0.0 /100 | #288 | Tragic 37.6% |