Immigrants from Senegal vs Immigrants from Argentina Average Family Size
COMPARE
Immigrants from Senegal
Immigrants from Argentina
Average Family Size
Average Family Size Comparison
Immigrants from Senegal
Immigrants from Argentina
3.23
AVERAGE FAMILY SIZE
57.5/ 100
METRIC RATING
166th/ 347
METRIC RANK
3.22
AVERAGE FAMILY SIZE
39.8/ 100
METRIC RATING
186th/ 347
METRIC RANK
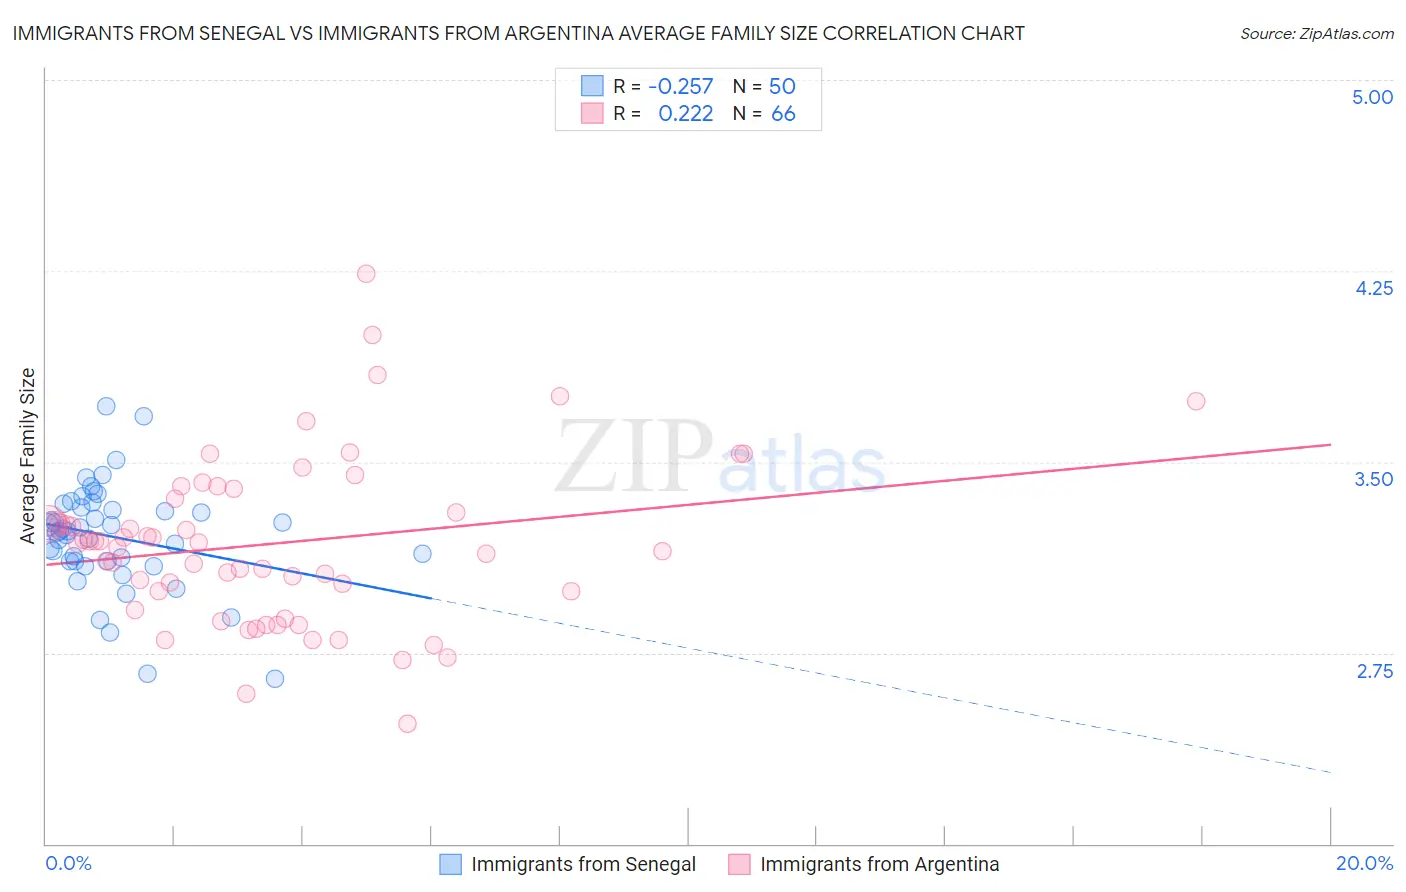
Immigrants from Senegal vs Immigrants from Argentina Average Family Size Correlation Chart
The statistical analysis conducted on geographies consisting of 90,123,819 people shows a weak negative correlation between the proportion of Immigrants from Senegal and average family size in the United States with a correlation coefficient (R) of -0.257 and weighted average of 3.23. Similarly, the statistical analysis conducted on geographies consisting of 264,360,356 people shows a weak positive correlation between the proportion of Immigrants from Argentina and average family size in the United States with a correlation coefficient (R) of 0.222 and weighted average of 3.22, a difference of 0.33%.
Average Family Size Correlation Summary
| Measurement | Immigrants from Senegal | Immigrants from Argentina |
| Minimum | 2.65 | 2.47 |
| Maximum | 3.72 | 4.24 |
| Range | 1.07 | 1.77 |
| Mean | 3.21 | 3.18 |
| Median | 3.23 | 3.18 |
| Interquartile 25% (IQ1) | 3.11 | 2.99 |
| Interquartile 75% (IQ3) | 3.32 | 3.36 |
| Interquartile Range (IQR) | 0.21 | 0.37 |
| Standard Deviation (Sample) | 0.21 | 0.33 |
| Standard Deviation (Population) | 0.21 | 0.32 |
Demographics Similar to Immigrants from Senegal and Immigrants from Argentina by Average Family Size
In terms of average family size, the demographic groups most similar to Immigrants from Senegal are Dutch West Indian (3.23, a difference of 0.010%), Taiwanese (3.23, a difference of 0.060%), Aleut (3.23, a difference of 0.060%), Arab (3.23, a difference of 0.070%), and Chilean (3.23, a difference of 0.080%). Similarly, the demographic groups most similar to Immigrants from Argentina are Immigrants from Sri Lanka (3.22, a difference of 0.0%), Immigrants from Eastern Asia (3.22, a difference of 0.020%), Immigrants from Northern Africa (3.22, a difference of 0.040%), Moroccan (3.22, a difference of 0.080%), and Spanish (3.23, a difference of 0.090%).
| Demographics | Rating | Rank | Average Family Size |
| Immigrants | Senegal | 57.5 /100 | #166 | Average 3.23 |
| Dutch West Indians | 56.9 /100 | #167 | Average 3.23 |
| Taiwanese | 54.2 /100 | #168 | Average 3.23 |
| Aleuts | 54.1 /100 | #169 | Average 3.23 |
| Arabs | 53.8 /100 | #170 | Average 3.23 |
| Chileans | 53.2 /100 | #171 | Average 3.23 |
| Immigrants | Congo | 52.7 /100 | #172 | Average 3.23 |
| Immigrants | Uruguay | 52.0 /100 | #173 | Average 3.23 |
| Immigrants | South Central Asia | 50.0 /100 | #174 | Average 3.23 |
| Immigrants | China | 49.9 /100 | #175 | Average 3.23 |
| Israelis | 48.7 /100 | #176 | Average 3.23 |
| Argentineans | 47.4 /100 | #177 | Average 3.23 |
| Spaniards | 47.2 /100 | #178 | Average 3.23 |
| Immigrants | Korea | 46.9 /100 | #179 | Average 3.23 |
| Palestinians | 46.6 /100 | #180 | Average 3.23 |
| Spanish | 44.8 /100 | #181 | Average 3.23 |
| Moroccans | 44.2 /100 | #182 | Average 3.22 |
| Immigrants | Northern Africa | 41.7 /100 | #183 | Average 3.22 |
| Immigrants | Eastern Asia | 40.8 /100 | #184 | Average 3.22 |
| Immigrants | Sri Lanka | 39.8 /100 | #185 | Fair 3.22 |
| Immigrants | Argentina | 39.8 /100 | #186 | Fair 3.22 |