Immigrants from Saudi Arabia vs Central American Indian Family Households with Children

COMPARE

Immigrants from Saudi Arabia
Race
Ancestry
AfghanAfricanAlaska NativeAlaskan AthabascanAlbanianAleutAlsatianAmericanApacheArabArapahoArgentineanArmenianAssyrian/Chaldean/SyriacAustralianAustrianBahamianBangladeshiBarbadianBasqueBelgianBelizeanBermudanBhutaneseBlackfeetBolivianBrazilianBritishBritish West IndianBulgarianBurmeseCajunCambodianCanadianCape VerdeanCarpatho RusynCelticCentral AmericanCherokeeCheyenneChickasawChileanChineseChippewaChoctawColombianColvilleComancheCosta RicanCreeCreekCroatianCrowCubanCypriotCzechCzechoslovakianDanishDelawareDominicanDutchDutch West IndianEastern EuropeanEcuadorianEgyptianEnglishEstonianEthiopianEuropeanFijianFilipinoFinnishFrenchFrench American IndianFrench CanadianGermanGerman RussianGhanaianGreekGuamanian/ChamorroGuatemalanGuyaneseHaitianHmongHonduranHopiHoumaHungarianIcelanderIndian (Asian)IndonesianInupiatIranianIraqiIrishIroquoisIsraeliItalianJamaicanJapaneseJordanianKenyanKiowaKoreanLaotianLatvianLebaneseLiberianLithuanianLumbeeLuxembourgerMacedonianMalaysianMalteseMarshalleseMenomineeMexicanMexican American IndianMongolianMoroccanNative HawaiianNavajoNepaleseNew ZealanderNicaraguanNigerianNorthern EuropeanNorwegianOkinawanOsageOttawaPaiutePakistaniPalestinianPanamanianParaguayanPennsylvania GermanPeruvianPimaPolishPortuguesePotawatomiPuebloPuerto RicanPuget Sound SalishRomanianRussianSalvadoranSamoanScandinavianScotch-IrishScottishSeminoleSenegaleseSerbianShoshoneSierra LeoneanSiouxSlavicSlovakSloveneSomaliSouth AfricanSouth AmericanSouth American IndianSoviet UnionSpaniardSpanishSpanish AmericanSpanish American IndianSri LankanSubsaharan AfricanSudaneseSwedishSwissSyrianTaiwaneseThaiTlingit-HaidaTohono O'OdhamTonganTrinidadian and TobagonianTsimshianTurkishU.S. Virgin IslanderUgandanUkrainianUruguayanUteVenezuelanVietnameseWelshWest IndianYakamaYaquiYugoslavianYumanYup'ikZimbabwean
Immigration
NonimmigrantsImmigrantsAfghanistanAfricaAlbaniaArgentinaArmeniaAsiaAustraliaAustriaBahamasBangladeshBarbadosBelarusBelgiumBelizeBoliviaBosnia and HerzegovinaBrazilBulgariaBurma/MyanmarCabo VerdeCambodiaCameroonCanadaCaribbeanCentral AmericaChileChinaColombiaCongoCosta RicaCroatiaCubaCzechoslovakiaDenmarkDominicaDominican RepublicEastern AfricaEastern AsiaEastern EuropeEcuadorEgyptEl SalvadorEnglandEritreaEthiopiaEuropeFijiFranceGermanyGhanaGreeceGrenadaGuatemalaGuyanaHaitiHondurasHong KongHungaryIndiaIndonesiaIranIraqIrelandIsraelItalyJamaicaJapanJordanKazakhstanKenyaKoreaKuwaitLaosLatin AmericaLatviaLebanonLiberiaLithuaniaMalaysiaMexicoMicronesiaMiddle AfricaMoldovaMoroccoNepalNetherlandsNicaraguaNigeriaNorth AmericaNorth MacedoniaNorthern AfricaNorthern EuropeNorwayOceaniaPakistanPanamaPeruPhilippinesPolandPortugalRomaniaRussiaSaudi ArabiaScotlandSenegalSerbiaSierra LeoneSingaporeSomaliaSouth AfricaSouth AmericaSouth Central AsiaSouth Eastern AsiaSouthern EuropeSpainSri LankaSt. Vincent and the GrenadinesSudanSwedenSwitzerlandSyriaTaiwanThailandTrinidad and TobagoTurkeyUgandaUkraineUruguayUzbekistanVenezuelaVietnamWest IndiesWestern AfricaWestern AsiaWestern EuropeYemenZaireZimbabweAzores
Central American Indian
Race
Ancestry
AfghanAfricanAlaska NativeAlaskan AthabascanAlbanianAleutAlsatianAmericanApacheArabArapahoArgentineanArmenianAssyrian/Chaldean/SyriacAustralianAustrianBahamianBangladeshiBarbadianBasqueBelgianBelizeanBermudanBhutaneseBlackfeetBolivianBrazilianBritishBritish West IndianBulgarianBurmeseCajunCambodianCanadianCape VerdeanCarpatho RusynCelticCentral AmericanCentral American IndianCherokeeCheyenneChickasawChileanChineseChippewaChoctawColombianColvilleComancheCosta RicanCreeCreekCroatianCrowCubanCypriotCzechCzechoslovakianDanishDelawareDominicanDutchDutch West IndianEastern EuropeanEcuadorianEgyptianEnglishEstonianEthiopianEuropeanFijianFilipinoFinnishFrenchFrench American IndianFrench CanadianGermanGerman RussianGhanaianGreekGuamanian/ChamorroGuatemalanGuyaneseHaitianHmongHonduranHopiHoumaHungarianIcelanderIndian (Asian)IndonesianInupiatIranianIraqiIrishIroquoisIsraeliItalianJamaicanJapaneseJordanianKenyanKiowaKoreanLaotianLatvianLebaneseLiberianLithuanianLumbeeLuxembourgerMacedonianMalaysianMalteseMarshalleseMenomineeMexicanMexican American IndianMongolianMoroccanNative HawaiianNavajoNepaleseNew ZealanderNicaraguanNigerianNorthern EuropeanNorwegianOkinawanOsageOttawaPaiutePakistaniPalestinianPanamanianParaguayanPennsylvania GermanPeruvianPimaPolishPortuguesePotawatomiPuebloPuerto RicanPuget Sound SalishRomanianRussianSalvadoranSamoanScandinavianScotch-IrishScottishSeminoleSenegaleseSerbianShoshoneSierra LeoneanSiouxSlavicSlovakSloveneSomaliSouth AfricanSouth AmericanSouth American IndianSoviet UnionSpaniardSpanishSpanish AmericanSpanish American IndianSri LankanSubsaharan AfricanSudaneseSwedishSwissSyrianTaiwaneseThaiTlingit-HaidaTohono O'OdhamTonganTrinidadian and TobagonianTsimshianTurkishU.S. Virgin IslanderUgandanUkrainianUruguayanUteVenezuelanVietnameseWelshWest IndianYakamaYaquiYugoslavianYumanYup'ikZimbabwean
Immigration
NonimmigrantsImmigrantsAfghanistanAfricaAlbaniaArgentinaArmeniaAsiaAustraliaAustriaBahamasBangladeshBarbadosBelarusBelgiumBelizeBoliviaBosnia and HerzegovinaBrazilBulgariaBurma/MyanmarCabo VerdeCambodiaCameroonCanadaCaribbeanCentral AmericaChileChinaColombiaCongoCosta RicaCroatiaCubaCzechoslovakiaDenmarkDominicaDominican RepublicEastern AfricaEastern AsiaEastern EuropeEcuadorEgyptEl SalvadorEnglandEritreaEthiopiaEuropeFijiFranceGermanyGhanaGreeceGrenadaGuatemalaGuyanaHaitiHondurasHong KongHungaryIndiaIndonesiaIranIraqIrelandIsraelItalyJamaicaJapanJordanKazakhstanKenyaKoreaKuwaitLaosLatin AmericaLatviaLebanonLiberiaLithuaniaMalaysiaMexicoMicronesiaMiddle AfricaMoldovaMoroccoNepalNetherlandsNicaraguaNigeriaNorth AmericaNorth MacedoniaNorthern AfricaNorthern EuropeNorwayOceaniaPakistanPanamaPeruPhilippinesPolandPortugalRomaniaRussiaScotlandSenegalSerbiaSierra LeoneSingaporeSomaliaSouth AfricaSouth AmericaSouth Central AsiaSouth Eastern AsiaSouthern EuropeSpainSri LankaSt. Vincent and the GrenadinesSudanSwedenSwitzerlandSyriaTaiwanThailandTrinidad and TobagoTurkeyUgandaUkraineUruguayUzbekistanVenezuelaVietnamWest IndiesWestern AfricaWestern AsiaWestern EuropeYemenZaireZimbabweAzores
Family Households with Children
Income
Poverty
Unemployment
Labor Participation
Family Structure
Vehicle Availability
Education Level
Disability

Family Households with Children Comparison

Immigrants from Saudi Arabia

Central American Indians

Tragic
Exceptional
26.9%
FAMILY HOUSEHOLDS WITH CHILDREN
2.9/ 100
METRIC RATING
243rd/ 347
METRIC RANK
27.9%
FAMILY HOUSEHOLDS WITH CHILDREN
95.9/ 100
METRIC RATING
118th/ 347
METRIC RANK

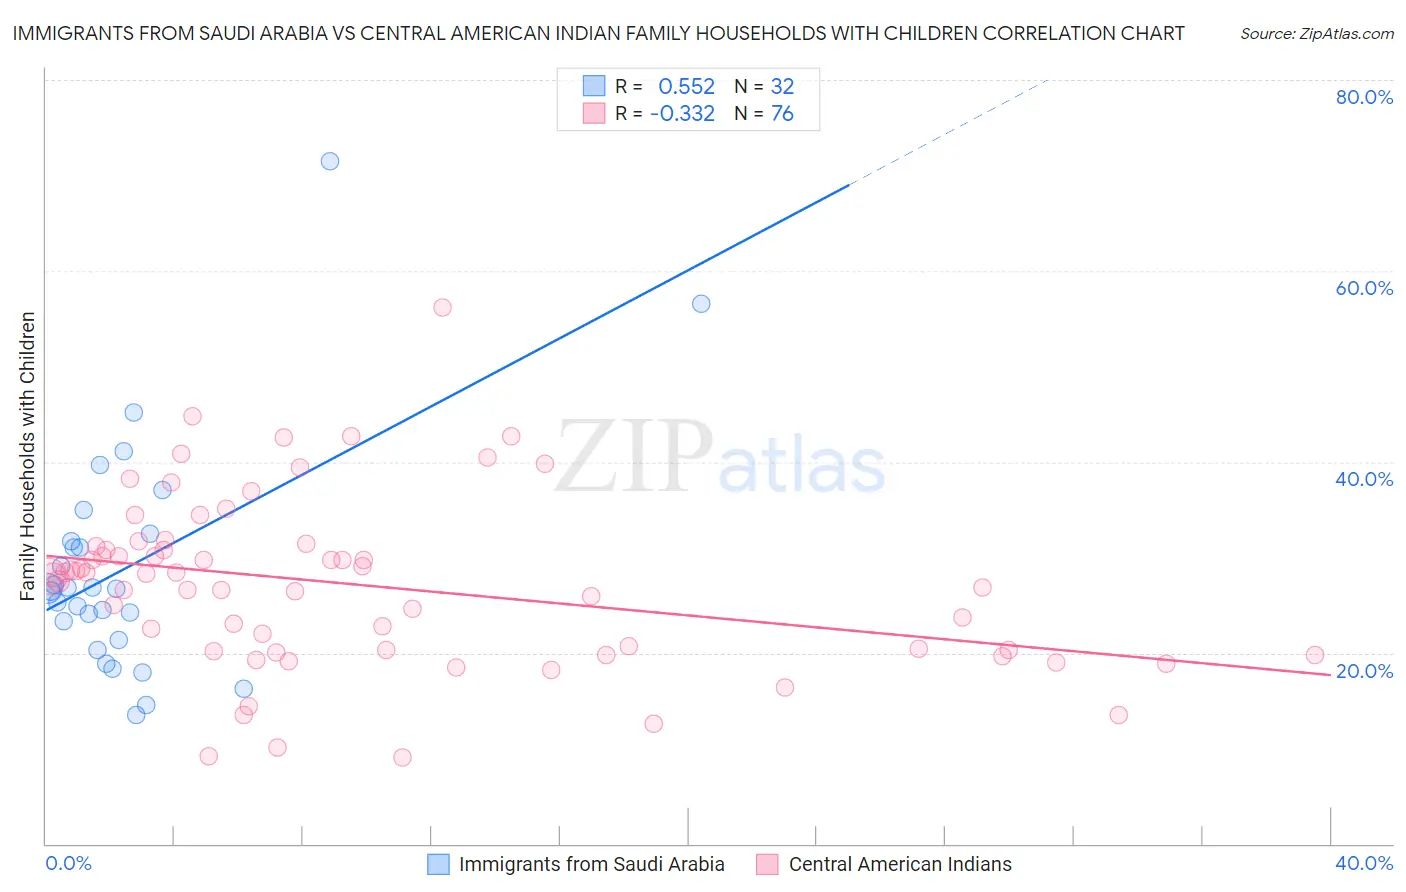
Immigrants from Saudi Arabia vs Central American Indian Family Households with Children Correlation Chart

The statistical analysis conducted on geographies consisting of 164,185,943 people shows a substantial positive correlation between the proportion of Immigrants from Saudi Arabia and percentage of family households with children in the United States with a correlation coefficient (R) of 0.552 and weighted average of 26.9%. Similarly, the statistical analysis conducted on geographies consisting of 326,008,789 people shows a mild negative correlation between the proportion of Central American Indians and percentage of family households with children in the United States with a correlation coefficient (R) of -0.332 and weighted average of 27.9%, a difference of 3.7%.
Immigrants from Saudi Arabia vs Central American Indian Family Households with Children

Family Households with Children Correlation Summary

MeasurementImmigrants from Saudi ArabiaCentral American Indian
Minimum13.5%9.0%
Maximum71.4%56.2%
Range58.0%47.2%
Mean29.0%27.1%
Median26.8%28.1%
Interquartile 25% (IQ1)22.4%20.2%
Interquartile 75% (IQ3)32.1%31.0%
Interquartile Range (IQR)9.7%10.8%
Standard Deviation (Sample)12.0%9.0%
Standard Deviation (Population)11.8%8.9%

Similar Demographics by Family Households with Children

Demographics Similar to Immigrants from Saudi Arabia by Family Households with Children

In terms of family households with children, the demographic groups most similar to Immigrants from Saudi Arabia are Ukrainian (26.9%, a difference of 0.010%), Australian (26.9%, a difference of 0.030%), Immigrants from Bulgaria (26.9%, a difference of 0.060%), Navajo (26.9%, a difference of 0.060%), and Immigrants from England (26.9%, a difference of 0.060%).
DemographicsRating | RankFamily Households with Children
Cape Verdeans
3.6
/100
|
#236
Tragic
26.9%
Immigrants | Netherlands
3.5
/100
|
#237
Tragic
26.9%
Moroccans
3.4
/100
|
#238
Tragic
26.9%
Immigrants | Southern Europe
3.4
/100
|
#239
Tragic
26.9%
Immigrants | Bulgaria
3.3
/100
|
#240
Tragic
26.9%
Navajo
3.2
/100
|
#241
Tragic
26.9%
Immigrants | England
3.2
/100
|
#242
Tragic
26.9%
Immigrants | Saudi Arabia
2.9
/100
|
#243
Tragic
26.9%
Ukrainians
2.9
/100
|
#244
Tragic
26.9%
Australians
2.8
/100
|
#245
Tragic
26.9%
Jamaicans
2.5
/100
|
#246
Tragic
26.9%
Potawatomi
2.2
/100
|
#247
Tragic
26.9%
Immigrants | Kazakhstan
2.2
/100
|
#248
Tragic
26.9%
Immigrants | Eastern Europe
2.1
/100
|
#249
Tragic
26.9%
Belgians
2.1
/100
|
#250
Tragic
26.9%

Demographics Similar to Central American Indians by Family Households with Children

In terms of family households with children, the demographic groups most similar to Central American Indians are Immigrants from Malaysia (27.9%, a difference of 0.0%), Pakistani (27.9%, a difference of 0.010%), Zimbabwean (27.9%, a difference of 0.040%), European (27.9%, a difference of 0.070%), and Immigrants from Africa (28.0%, a difference of 0.14%).
DemographicsRating | RankFamily Households with Children
Scandinavians
97.1
/100
|
#111
Exceptional
28.0%
Immigrants | Middle Africa
97.0
/100
|
#112
Exceptional
28.0%
Arabs
97.0
/100
|
#113
Exceptional
28.0%
South American Indians
96.9
/100
|
#114
Exceptional
28.0%
Immigrants | Africa
96.8
/100
|
#115
Exceptional
28.0%
Pakistanis
96.0
/100
|
#116
Exceptional
27.9%
Immigrants | Malaysia
95.9
/100
|
#117
Exceptional
27.9%
Central American Indians
95.9
/100
|
#118
Exceptional
27.9%
Zimbabweans
95.6
/100
|
#119
Exceptional
27.9%
Europeans
95.4
/100
|
#120
Exceptional
27.9%
Immigrants | Western Asia
93.6
/100
|
#121
Exceptional
27.9%
Immigrants | Zimbabwe
92.8
/100
|
#122
Exceptional
27.8%
Immigrants | Northern Africa
91.8
/100
|
#123
Exceptional
27.8%
Immigrants | Singapore
90.8
/100
|
#124
Exceptional
27.8%
Ecuadorians
90.8
/100
|
#125
Exceptional
27.8%