Immigrants from Romania vs Palestinian Family Households
COMPARE
Immigrants from Romania
Palestinian
Family Households
Family Households Comparison
Immigrants from Romania
Palestinians
64.6%
FAMILY HOUSEHOLDS
77.0/ 100
METRIC RATING
146th/ 347
METRIC RANK
65.1%
FAMILY HOUSEHOLDS
97.2/ 100
METRIC RATING
108th/ 347
METRIC RANK
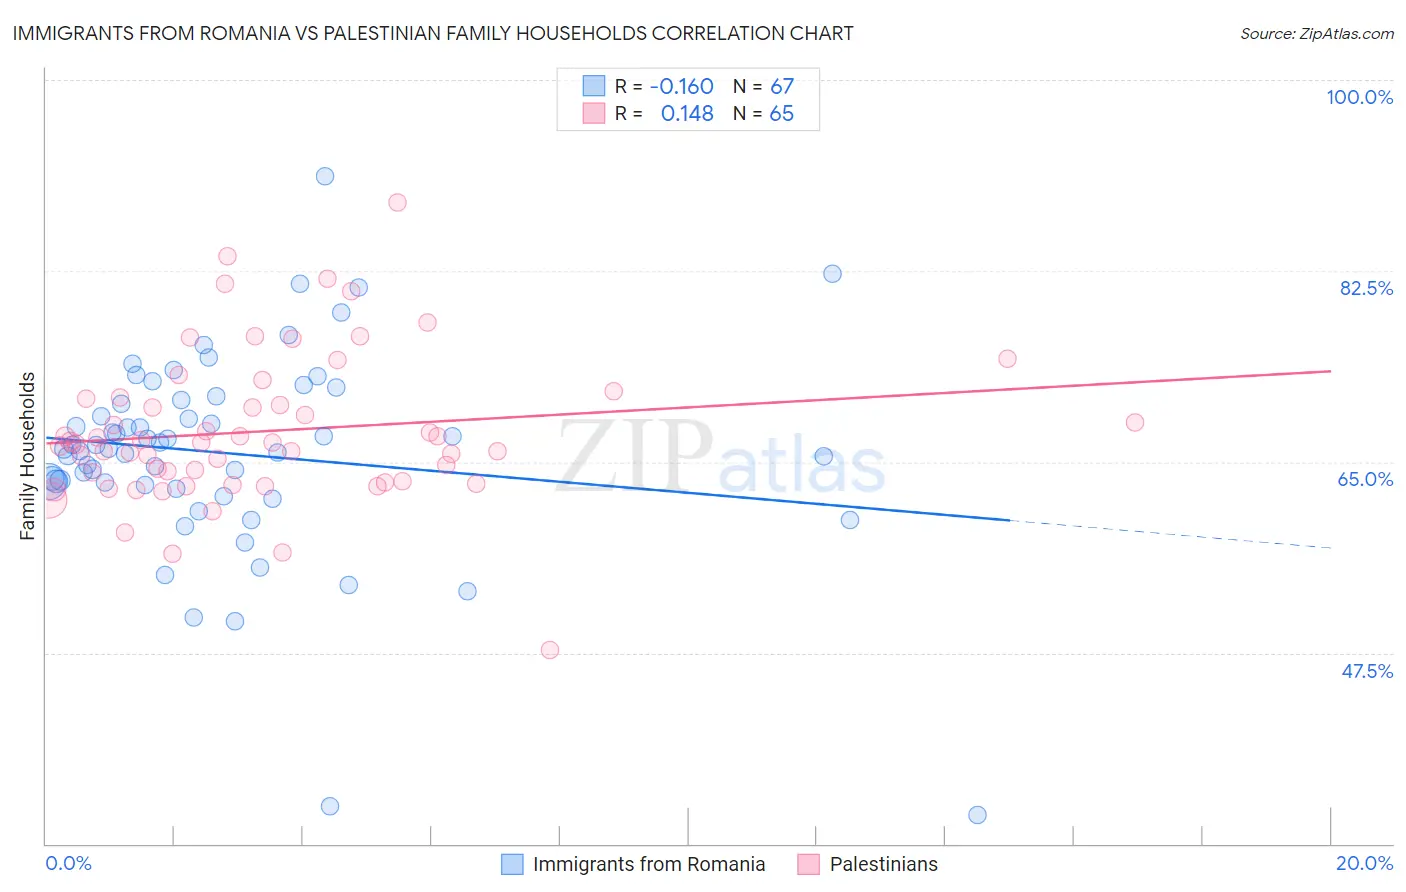
Immigrants from Romania vs Palestinian Family Households Correlation Chart
The statistical analysis conducted on geographies consisting of 256,963,245 people shows a poor negative correlation between the proportion of Immigrants from Romania and percentage of family households in the United States with a correlation coefficient (R) of -0.160 and weighted average of 64.6%. Similarly, the statistical analysis conducted on geographies consisting of 216,401,165 people shows a poor positive correlation between the proportion of Palestinians and percentage of family households in the United States with a correlation coefficient (R) of 0.148 and weighted average of 65.1%, a difference of 0.79%.
Family Households Correlation Summary
| Measurement | Immigrants from Romania | Palestinian |
| Minimum | 32.6% | 47.7% |
| Maximum | 91.2% | 88.8% |
| Range | 58.6% | 41.1% |
| Mean | 65.8% | 67.8% |
| Median | 66.2% | 66.8% |
| Interquartile 25% (IQ1) | 62.9% | 63.2% |
| Interquartile 75% (IQ3) | 70.7% | 70.8% |
| Interquartile Range (IQR) | 7.8% | 7.7% |
| Standard Deviation (Sample) | 9.4% | 6.9% |
| Standard Deviation (Population) | 9.3% | 6.8% |
Similar Demographics by Family Households
Demographics Similar to Immigrants from Romania by Family Households
In terms of family households, the demographic groups most similar to Immigrants from Romania are Immigrants from Chile (64.6%, a difference of 0.010%), Delaware (64.6%, a difference of 0.010%), Sioux (64.6%, a difference of 0.010%), Romanian (64.5%, a difference of 0.030%), and Syrian (64.5%, a difference of 0.030%).
| Demographics | Rating | Rank | Family Households |
| Immigrants | Jamaica | 85.3 /100 | #139 | Excellent 64.7% |
| Immigrants | North Macedonia | 84.9 /100 | #140 | Excellent 64.7% |
| Immigrants | Cameroon | 84.8 /100 | #141 | Excellent 64.7% |
| Pakistanis | 84.0 /100 | #142 | Excellent 64.7% |
| Czechoslovakians | 82.1 /100 | #143 | Excellent 64.6% |
| South American Indians | 81.9 /100 | #144 | Excellent 64.6% |
| Welsh | 80.1 /100 | #145 | Excellent 64.6% |
| Immigrants | Romania | 77.0 /100 | #146 | Good 64.6% |
| Immigrants | Chile | 76.5 /100 | #147 | Good 64.6% |
| Delaware | 76.3 /100 | #148 | Good 64.6% |
| Sioux | 76.3 /100 | #149 | Good 64.6% |
| Romanians | 75.3 /100 | #150 | Good 64.5% |
| Syrians | 75.2 /100 | #151 | Good 64.5% |
| Scottish | 70.9 /100 | #152 | Good 64.5% |
| Swedes | 69.8 /100 | #153 | Good 64.5% |
Demographics Similar to Palestinians by Family Households
In terms of family households, the demographic groups most similar to Palestinians are White/Caucasian (65.1%, a difference of 0.010%), Alaska Native (65.1%, a difference of 0.010%), English (65.1%, a difference of 0.020%), Immigrants from Guatemala (65.0%, a difference of 0.040%), and Scandinavian (65.0%, a difference of 0.050%).
| Demographics | Rating | Rank | Family Households |
| Chileans | 98.1 /100 | #101 | Exceptional 65.2% |
| Immigrants | Sri Lanka | 98.0 /100 | #102 | Exceptional 65.1% |
| Indians (Asian) | 97.9 /100 | #103 | Exceptional 65.1% |
| Spaniards | 97.8 /100 | #104 | Exceptional 65.1% |
| English | 97.4 /100 | #105 | Exceptional 65.1% |
| Whites/Caucasians | 97.3 /100 | #106 | Exceptional 65.1% |
| Alaska Natives | 97.3 /100 | #107 | Exceptional 65.1% |
| Palestinians | 97.2 /100 | #108 | Exceptional 65.1% |
| Immigrants | Guatemala | 96.9 /100 | #109 | Exceptional 65.0% |
| Scandinavians | 96.8 /100 | #110 | Exceptional 65.0% |
| Europeans | 96.8 /100 | #111 | Exceptional 65.0% |
| Immigrants | Jordan | 96.5 /100 | #112 | Exceptional 65.0% |
| Spanish | 96.2 /100 | #113 | Exceptional 65.0% |
| Argentineans | 95.7 /100 | #114 | Exceptional 65.0% |
| Ecuadorians | 95.4 /100 | #115 | Exceptional 65.0% |