Immigrants from Philippines vs Celtic Family Households with Children

COMPARE

Immigrants from Philippines
Race
Ancestry
AfghanAfricanAlaska NativeAlaskan AthabascanAlbanianAleutAlsatianAmericanApacheArabArapahoArgentineanArmenianAssyrian/Chaldean/SyriacAustralianAustrianBahamianBangladeshiBarbadianBasqueBelgianBelizeanBermudanBhutaneseBlackfeetBolivianBrazilianBritishBritish West IndianBulgarianBurmeseCajunCambodianCanadianCape VerdeanCarpatho RusynCentral AmericanCentral American IndianCherokeeCheyenneChickasawChileanChineseChippewaChoctawColombianColvilleComancheCosta RicanCreeCreekCroatianCrowCubanCypriotCzechCzechoslovakianDanishDelawareDominicanDutchDutch West IndianEastern EuropeanEcuadorianEgyptianEnglishEstonianEthiopianEuropeanFijianFilipinoFinnishFrenchFrench American IndianFrench CanadianGermanGerman RussianGhanaianGreekGuamanian/ChamorroGuatemalanGuyaneseHaitianHmongHonduranHopiHoumaHungarianIcelanderIndian (Asian)IndonesianInupiatIranianIraqiIrishIroquoisIsraeliItalianJamaicanJapaneseJordanianKenyanKiowaKoreanLaotianLatvianLebaneseLiberianLithuanianLumbeeLuxembourgerMacedonianMalaysianMalteseMarshalleseMenomineeMexicanMexican American IndianMongolianMoroccanNative HawaiianNavajoNepaleseNew ZealanderNicaraguanNigerianNorthern EuropeanNorwegianOkinawanOsageOttawaPaiutePakistaniPalestinianPanamanianParaguayanPennsylvania GermanPeruvianPimaPolishPortuguesePotawatomiPuebloPuerto RicanPuget Sound SalishRomanianRussianSalvadoranSamoanScandinavianScotch-IrishScottishSeminoleSenegaleseSerbianShoshoneSierra LeoneanSiouxSlavicSlovakSloveneSomaliSouth AfricanSouth AmericanSouth American IndianSoviet UnionSpaniardSpanishSpanish AmericanSpanish American IndianSri LankanSubsaharan AfricanSudaneseSwedishSwissSyrianTaiwaneseThaiTlingit-HaidaTohono O'OdhamTonganTrinidadian and TobagonianTsimshianTurkishU.S. Virgin IslanderUgandanUkrainianUruguayanUteVenezuelanVietnameseWelshWest IndianYakamaYaquiYugoslavianYumanYup'ikZimbabwean
Immigration
NonimmigrantsImmigrantsAfghanistanAfricaAlbaniaArgentinaArmeniaAsiaAustraliaAustriaBahamasBangladeshBarbadosBelarusBelgiumBelizeBoliviaBosnia and HerzegovinaBrazilBulgariaBurma/MyanmarCabo VerdeCambodiaCameroonCanadaCaribbeanCentral AmericaChileChinaColombiaCongoCosta RicaCroatiaCubaCzechoslovakiaDenmarkDominicaDominican RepublicEastern AfricaEastern AsiaEastern EuropeEcuadorEgyptEl SalvadorEnglandEritreaEthiopiaEuropeFijiFranceGermanyGhanaGreeceGrenadaGuatemalaGuyanaHaitiHondurasHong KongHungaryIndiaIndonesiaIranIraqIrelandIsraelItalyJamaicaJapanJordanKazakhstanKenyaKoreaKuwaitLaosLatin AmericaLatviaLebanonLiberiaLithuaniaMalaysiaMexicoMicronesiaMiddle AfricaMoldovaMoroccoNepalNetherlandsNicaraguaNigeriaNorth AmericaNorth MacedoniaNorthern AfricaNorthern EuropeNorwayOceaniaPakistanPanamaPeruPhilippinesPolandPortugalRomaniaRussiaSaudi ArabiaScotlandSenegalSerbiaSierra LeoneSingaporeSomaliaSouth AfricaSouth AmericaSouth Central AsiaSouth Eastern AsiaSouthern EuropeSpainSri LankaSt. Vincent and the GrenadinesSudanSwedenSwitzerlandSyriaTaiwanThailandTrinidad and TobagoTurkeyUgandaUkraineUruguayUzbekistanVenezuelaVietnamWest IndiesWestern AfricaWestern AsiaWestern EuropeYemenZaireZimbabweAzores
Celtic
Race
Ancestry
AfghanAfricanAlaska NativeAlaskan AthabascanAlbanianAleutAlsatianAmericanApacheArabArapahoArgentineanArmenianAssyrian/Chaldean/SyriacAustralianAustrianBahamianBangladeshiBarbadianBasqueBelgianBelizeanBermudanBhutaneseBlackfeetBolivianBrazilianBritishBritish West IndianBulgarianBurmeseCajunCambodianCanadianCape VerdeanCarpatho RusynCelticCentral AmericanCentral American IndianCherokeeCheyenneChickasawChileanChineseChippewaChoctawColombianColvilleComancheCosta RicanCreeCreekCroatianCrowCubanCypriotCzechCzechoslovakianDanishDelawareDominicanDutchDutch West IndianEastern EuropeanEcuadorianEgyptianEnglishEstonianEthiopianEuropeanFijianFilipinoFinnishFrenchFrench American IndianFrench CanadianGermanGerman RussianGhanaianGreekGuamanian/ChamorroGuatemalanGuyaneseHaitianHmongHonduranHopiHoumaHungarianIcelanderIndian (Asian)IndonesianInupiatIranianIraqiIrishIroquoisIsraeliItalianJamaicanJapaneseJordanianKenyanKiowaKoreanLaotianLatvianLebaneseLiberianLithuanianLumbeeLuxembourgerMacedonianMalaysianMalteseMarshalleseMenomineeMexicanMexican American IndianMongolianMoroccanNative HawaiianNavajoNepaleseNew ZealanderNicaraguanNigerianNorthern EuropeanNorwegianOkinawanOsageOttawaPaiutePakistaniPalestinianPanamanianParaguayanPennsylvania GermanPeruvianPimaPolishPortuguesePotawatomiPuebloPuerto RicanPuget Sound SalishRomanianRussianSalvadoranSamoanScandinavianScotch-IrishScottishSeminoleSenegaleseSerbianShoshoneSierra LeoneanSiouxSlavicSlovakSloveneSomaliSouth AfricanSouth AmericanSouth American IndianSoviet UnionSpaniardSpanishSpanish AmericanSpanish American IndianSri LankanSubsaharan AfricanSudaneseSwedishSwissSyrianTaiwaneseThaiTlingit-HaidaTohono O'OdhamTonganTrinidadian and TobagonianTsimshianTurkishU.S. Virgin IslanderUgandanUkrainianUruguayanUteVenezuelanVietnameseWelshWest IndianYakamaYaquiYugoslavianYumanYup'ikZimbabwean
Immigration
NonimmigrantsImmigrantsAfghanistanAfricaAlbaniaArgentinaArmeniaAsiaAustraliaAustriaBahamasBangladeshBarbadosBelarusBelgiumBelizeBoliviaBosnia and HerzegovinaBrazilBulgariaBurma/MyanmarCabo VerdeCambodiaCameroonCanadaCaribbeanCentral AmericaChileChinaColombiaCongoCosta RicaCroatiaCubaCzechoslovakiaDenmarkDominicaDominican RepublicEastern AfricaEastern AsiaEastern EuropeEcuadorEgyptEl SalvadorEnglandEritreaEthiopiaEuropeFijiFranceGermanyGhanaGreeceGrenadaGuatemalaGuyanaHaitiHondurasHong KongHungaryIndiaIndonesiaIranIraqIrelandIsraelItalyJamaicaJapanJordanKazakhstanKenyaKoreaKuwaitLaosLatin AmericaLatviaLebanonLiberiaLithuaniaMalaysiaMexicoMicronesiaMiddle AfricaMoldovaMoroccoNepalNetherlandsNicaraguaNigeriaNorth AmericaNorth MacedoniaNorthern AfricaNorthern EuropeNorwayOceaniaPakistanPanamaPeruPolandPortugalRomaniaRussiaSaudi ArabiaScotlandSenegalSerbiaSierra LeoneSingaporeSomaliaSouth AfricaSouth AmericaSouth Central AsiaSouth Eastern AsiaSouthern EuropeSpainSri LankaSt. Vincent and the GrenadinesSudanSwedenSwitzerlandSyriaTaiwanThailandTrinidad and TobagoTurkeyUgandaUkraineUruguayUzbekistanVenezuelaVietnamWest IndiesWestern AfricaWestern AsiaWestern EuropeYemenZaireZimbabweAzores
Family Households with Children
Income
Poverty
Unemployment
Labor Participation
Family Structure
Vehicle Availability
Education Level
Disability

Family Households with Children Comparison

Immigrants from Philippines

Celtics

Exceptional
Tragic
29.0%
FAMILY HOUSEHOLDS WITH CHILDREN
100.0/ 100
METRIC RATING
46th/ 347
METRIC RANK
26.6%
FAMILY HOUSEHOLDS WITH CHILDREN
0.4/ 100
METRIC RATING
277th/ 347
METRIC RANK

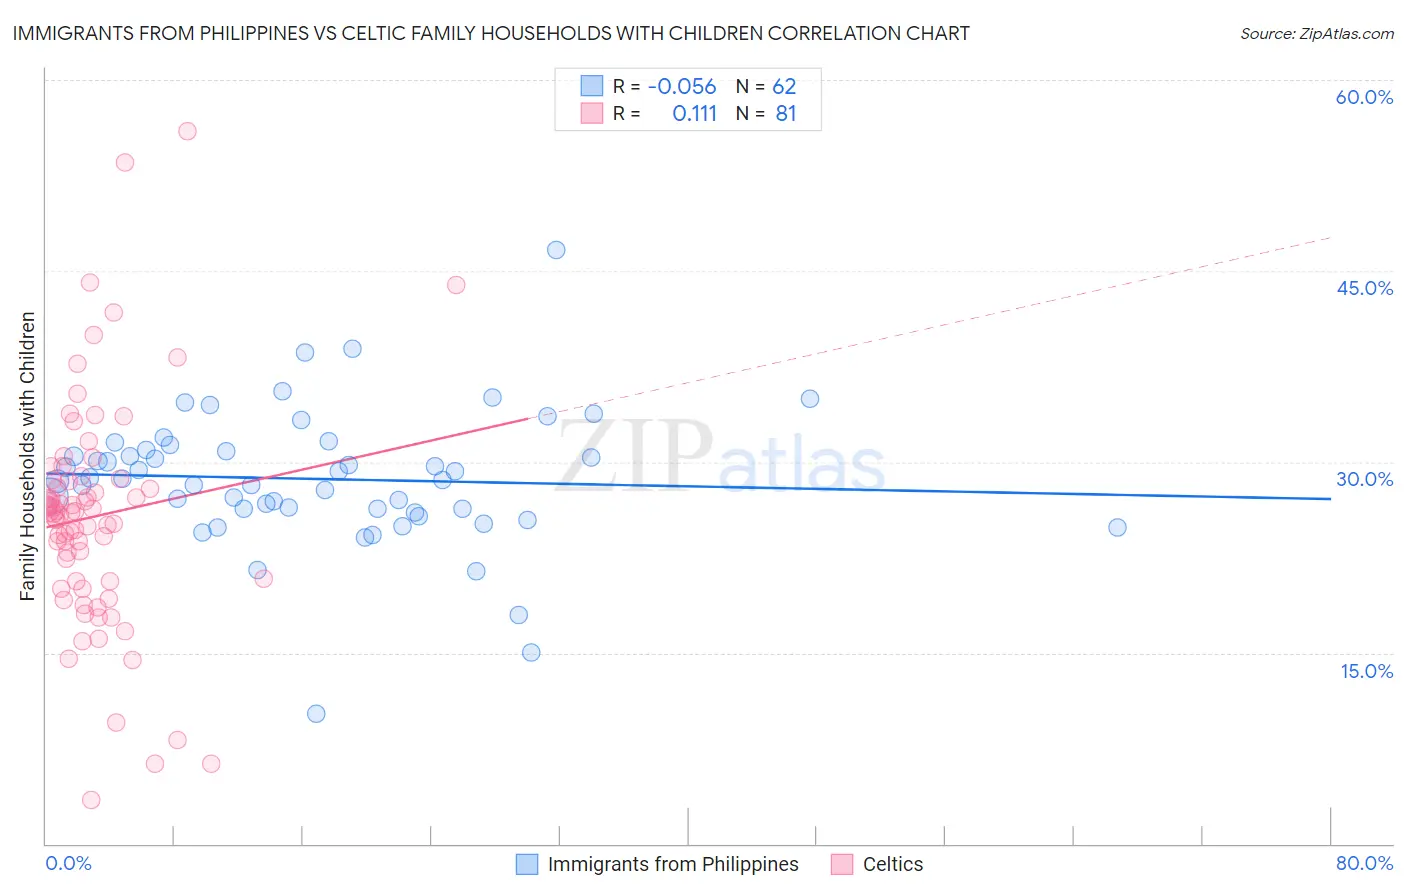
Immigrants from Philippines vs Celtic Family Households with Children Correlation Chart

The statistical analysis conducted on geographies consisting of 470,847,260 people shows a slight negative correlation between the proportion of Immigrants from Philippines and percentage of family households with children in the United States with a correlation coefficient (R) of -0.056 and weighted average of 29.0%. Similarly, the statistical analysis conducted on geographies consisting of 168,845,101 people shows a poor positive correlation between the proportion of Celtics and percentage of family households with children in the United States with a correlation coefficient (R) of 0.111 and weighted average of 26.6%, a difference of 8.9%.
Immigrants from Philippines vs Celtic Family Households with Children

Family Households with Children Correlation Summary

MeasurementImmigrants from PhilippinesCeltic
Minimum10.2%3.4%
Maximum46.7%55.9%
Range36.5%52.5%
Mean28.7%25.7%
Median28.6%26.1%
Interquartile 25% (IQ1)26.3%20.6%
Interquartile 75% (IQ3)31.0%28.7%
Interquartile Range (IQR)4.7%8.0%
Standard Deviation (Sample)5.4%9.0%
Standard Deviation (Population)5.4%9.0%

Similar Demographics by Family Households with Children

Demographics Similar to Immigrants from Philippines by Family Households with Children

In terms of family households with children, the demographic groups most similar to Immigrants from Philippines are Peruvian (29.0%, a difference of 0.010%), Apache (29.0%, a difference of 0.040%), Fijian (29.0%, a difference of 0.090%), Jordanian (29.0%, a difference of 0.13%), and Immigrants from Taiwan (29.0%, a difference of 0.14%).
DemographicsRating | RankFamily Households with Children
Yaqui
100.0
/100
|
#39
Exceptional
29.1%
Central Americans
100.0
/100
|
#40
Exceptional
29.1%
Immigrants | South Eastern Asia
100.0
/100
|
#41
Exceptional
29.1%
Spanish American Indians
100.0
/100
|
#42
Exceptional
29.1%
Asians
100.0
/100
|
#43
Exceptional
29.1%
Immigrants | Taiwan
100.0
/100
|
#44
Exceptional
29.0%
Fijians
100.0
/100
|
#45
Exceptional
29.0%
Immigrants | Philippines
100.0
/100
|
#46
Exceptional
29.0%
Peruvians
100.0
/100
|
#47
Exceptional
29.0%
Apache
100.0
/100
|
#48
Exceptional
29.0%
Jordanians
100.0
/100
|
#49
Exceptional
29.0%
Immigrants | Immigrants
100.0
/100
|
#50
Exceptional
28.9%
Immigrants | Peru
100.0
/100
|
#51
Exceptional
28.9%
Guatemalans
100.0
/100
|
#52
Exceptional
28.9%
Immigrants | Cambodia
100.0
/100
|
#53
Exceptional
28.9%

Demographics Similar to Celtics by Family Households with Children

In terms of family households with children, the demographic groups most similar to Celtics are Immigrants from Europe (26.6%, a difference of 0.060%), Immigrants from Spain (26.6%, a difference of 0.080%), Finnish (26.6%, a difference of 0.080%), Senegalese (26.6%, a difference of 0.10%), and Immigrants from Northern Europe (26.7%, a difference of 0.11%).
DemographicsRating | RankFamily Households with Children
Immigrants | Zaire
0.7
/100
|
#270
Tragic
26.7%
French
0.7
/100
|
#271
Tragic
26.7%
Somalis
0.7
/100
|
#272
Tragic
26.7%
Immigrants | Hungary
0.6
/100
|
#273
Tragic
26.7%
Eastern Europeans
0.6
/100
|
#274
Tragic
26.7%
Immigrants | Northern Europe
0.5
/100
|
#275
Tragic
26.7%
Immigrants | Spain
0.5
/100
|
#276
Tragic
26.6%
Celtics
0.4
/100
|
#277
Tragic
26.6%
Immigrants | Europe
0.4
/100
|
#278
Tragic
26.6%
Finns
0.4
/100
|
#279
Tragic
26.6%
Senegalese
0.4
/100
|
#280
Tragic
26.6%
Lithuanians
0.3
/100
|
#281
Tragic
26.6%
French American Indians
0.3
/100
|
#282
Tragic
26.6%
Immigrants | North America
0.3
/100
|
#283
Tragic
26.6%
Immigrants | Canada
0.3
/100
|
#284
Tragic
26.5%