Immigrants from Oceania vs Shoshone Births to Unmarried Women

COMPARE

Immigrants from Oceania
Race
Ancestry
AfghanAfricanAlaska NativeAlaskan AthabascanAlbanianAleutAlsatianAmericanApacheArabArapahoArgentineanArmenianAssyrian/Chaldean/SyriacAustralianAustrianBahamianBangladeshiBarbadianBasqueBelgianBelizeanBermudanBhutaneseBlackfeetBolivianBrazilianBritishBritish West IndianBulgarianBurmeseCajunCambodianCanadianCape VerdeanCarpatho RusynCelticCentral AmericanCentral American IndianCherokeeCheyenneChickasawChileanChineseChippewaChoctawColombianColvilleComancheCosta RicanCreeCreekCroatianCrowCubanCypriotCzechCzechoslovakianDanishDelawareDominicanDutchDutch West IndianEastern EuropeanEcuadorianEgyptianEnglishEstonianEthiopianEuropeanFijianFilipinoFinnishFrenchFrench American IndianFrench CanadianGermanGerman RussianGhanaianGreekGuamanian/ChamorroGuatemalanGuyaneseHaitianHmongHonduranHopiHoumaHungarianIcelanderIndian (Asian)IndonesianInupiatIranianIraqiIrishIroquoisIsraeliItalianJamaicanJapaneseJordanianKenyanKiowaKoreanLaotianLatvianLebaneseLiberianLithuanianLumbeeLuxembourgerMacedonianMalaysianMalteseMarshalleseMenomineeMexicanMexican American IndianMongolianMoroccanNative HawaiianNavajoNepaleseNew ZealanderNicaraguanNigerianNorthern EuropeanNorwegianOkinawanOsageOttawaPaiutePakistaniPalestinianPanamanianParaguayanPennsylvania GermanPeruvianPimaPolishPortuguesePotawatomiPuebloPuerto RicanPuget Sound SalishRomanianRussianSalvadoranSamoanScandinavianScotch-IrishScottishSeminoleSenegaleseSerbianSierra LeoneanSiouxSlavicSlovakSloveneSomaliSouth AfricanSouth AmericanSouth American IndianSoviet UnionSpaniardSpanishSpanish AmericanSpanish American IndianSri LankanSubsaharan AfricanSudaneseSwedishSwissSyrianTaiwaneseThaiTlingit-HaidaTohono O'OdhamTonganTrinidadian and TobagonianTsimshianTurkishU.S. Virgin IslanderUgandanUkrainianUruguayanUteVenezuelanVietnameseWelshWest IndianYakamaYaquiYugoslavianYumanYup'ikZimbabwean
Immigration
NonimmigrantsImmigrantsAfghanistanAfricaAlbaniaArgentinaArmeniaAsiaAustraliaAustriaBahamasBangladeshBarbadosBelarusBelgiumBelizeBoliviaBosnia and HerzegovinaBrazilBulgariaBurma/MyanmarCabo VerdeCambodiaCameroonCanadaCaribbeanCentral AmericaChileChinaColombiaCongoCosta RicaCroatiaCubaCzechoslovakiaDenmarkDominicaDominican RepublicEastern AfricaEastern AsiaEastern EuropeEcuadorEgyptEl SalvadorEnglandEritreaEthiopiaEuropeFijiFranceGermanyGhanaGreeceGrenadaGuatemalaGuyanaHaitiHondurasHong KongHungaryIndiaIndonesiaIranIraqIrelandIsraelItalyJamaicaJapanJordanKazakhstanKenyaKoreaKuwaitLaosLatin AmericaLatviaLebanonLiberiaLithuaniaMalaysiaMexicoMicronesiaMiddle AfricaMoldovaMoroccoNepalNetherlandsNicaraguaNigeriaNorth AmericaNorth MacedoniaNorthern AfricaNorthern EuropeNorwayOceaniaPakistanPanamaPeruPhilippinesPolandPortugalRomaniaRussiaSaudi ArabiaScotlandSenegalSerbiaSierra LeoneSingaporeSomaliaSouth AfricaSouth AmericaSouth Central AsiaSouth Eastern AsiaSouthern EuropeSpainSri LankaSt. Vincent and the GrenadinesSudanSwedenSwitzerlandSyriaTaiwanThailandTrinidad and TobagoTurkeyUgandaUkraineUruguayUzbekistanVenezuelaVietnamWest IndiesWestern AfricaWestern AsiaWestern EuropeYemenZaireZimbabweAzores
Shoshone
Race
Ancestry
AfghanAfricanAlaska NativeAlaskan AthabascanAlbanianAleutAlsatianAmericanApacheArabArapahoArgentineanArmenianAssyrian/Chaldean/SyriacAustralianAustrianBahamianBangladeshiBarbadianBasqueBelgianBelizeanBermudanBhutaneseBlackfeetBolivianBrazilianBritishBritish West IndianBulgarianBurmeseCajunCambodianCanadianCape VerdeanCarpatho RusynCelticCentral AmericanCentral American IndianCherokeeCheyenneChickasawChileanChineseChippewaChoctawColombianColvilleComancheCosta RicanCreeCreekCroatianCrowCubanCypriotCzechCzechoslovakianDanishDelawareDominicanDutchDutch West IndianEastern EuropeanEcuadorianEgyptianEnglishEstonianEthiopianEuropeanFijianFilipinoFinnishFrenchFrench American IndianFrench CanadianGermanGerman RussianGhanaianGreekGuamanian/ChamorroGuatemalanGuyaneseHaitianHmongHonduranHopiHoumaHungarianIcelanderIndian (Asian)IndonesianInupiatIranianIraqiIrishIroquoisIsraeliItalianJamaicanJapaneseJordanianKenyanKiowaKoreanLaotianLatvianLebaneseLiberianLithuanianLumbeeLuxembourgerMacedonianMalaysianMalteseMarshalleseMenomineeMexicanMexican American IndianMongolianMoroccanNative HawaiianNavajoNepaleseNew ZealanderNicaraguanNigerianNorthern EuropeanNorwegianOkinawanOsageOttawaPaiutePakistaniPalestinianPanamanianParaguayanPennsylvania GermanPeruvianPimaPolishPortuguesePotawatomiPuebloPuerto RicanPuget Sound SalishRomanianRussianSalvadoranSamoanScandinavianScotch-IrishScottishSeminoleSenegaleseSerbianShoshoneSierra LeoneanSiouxSlavicSlovakSloveneSomaliSouth AfricanSouth AmericanSouth American IndianSoviet UnionSpaniardSpanishSpanish AmericanSpanish American IndianSri LankanSubsaharan AfricanSudaneseSwedishSwissSyrianTaiwaneseThaiTlingit-HaidaTohono O'OdhamTonganTrinidadian and TobagonianTsimshianTurkishU.S. Virgin IslanderUgandanUkrainianUruguayanUteVenezuelanVietnameseWelshWest IndianYakamaYaquiYugoslavianYumanYup'ikZimbabwean
Immigration
NonimmigrantsImmigrantsAfghanistanAfricaAlbaniaArgentinaArmeniaAsiaAustraliaAustriaBahamasBangladeshBarbadosBelarusBelgiumBelizeBoliviaBosnia and HerzegovinaBrazilBulgariaBurma/MyanmarCabo VerdeCambodiaCameroonCanadaCaribbeanCentral AmericaChileChinaColombiaCongoCosta RicaCroatiaCubaCzechoslovakiaDenmarkDominicaDominican RepublicEastern AfricaEastern AsiaEastern EuropeEcuadorEgyptEl SalvadorEnglandEritreaEthiopiaEuropeFijiFranceGermanyGhanaGreeceGrenadaGuatemalaGuyanaHaitiHondurasHong KongHungaryIndiaIndonesiaIranIraqIrelandIsraelItalyJamaicaJapanJordanKazakhstanKenyaKoreaKuwaitLaosLatin AmericaLatviaLebanonLiberiaLithuaniaMalaysiaMexicoMicronesiaMiddle AfricaMoldovaMoroccoNepalNetherlandsNicaraguaNigeriaNorth AmericaNorth MacedoniaNorthern AfricaNorthern EuropeNorwayPakistanPanamaPeruPhilippinesPolandPortugalRomaniaRussiaSaudi ArabiaScotlandSenegalSerbiaSierra LeoneSingaporeSomaliaSouth AfricaSouth AmericaSouth Central AsiaSouth Eastern AsiaSouthern EuropeSpainSri LankaSt. Vincent and the GrenadinesSudanSwedenSwitzerlandSyriaTaiwanThailandTrinidad and TobagoTurkeyUgandaUkraineUruguayUzbekistanVenezuelaVietnamWest IndiesWestern AfricaWestern AsiaWestern EuropeYemenZaireZimbabweAzores
Births to Unmarried Women
Income
Poverty
Unemployment
Labor Participation
Family Structure
Vehicle Availability
Education Level
Disability

Births to Unmarried Women Comparison

Immigrants from Oceania

Shoshone

Excellent
Tragic
30.6%
BIRTHS TO UNMARRIED WOMEN
81.2/ 100
METRIC RATING
147th/ 347
METRIC RANK
35.3%
BIRTHS TO UNMARRIED WOMEN
0.8/ 100
METRIC RATING
245th/ 347
METRIC RANK

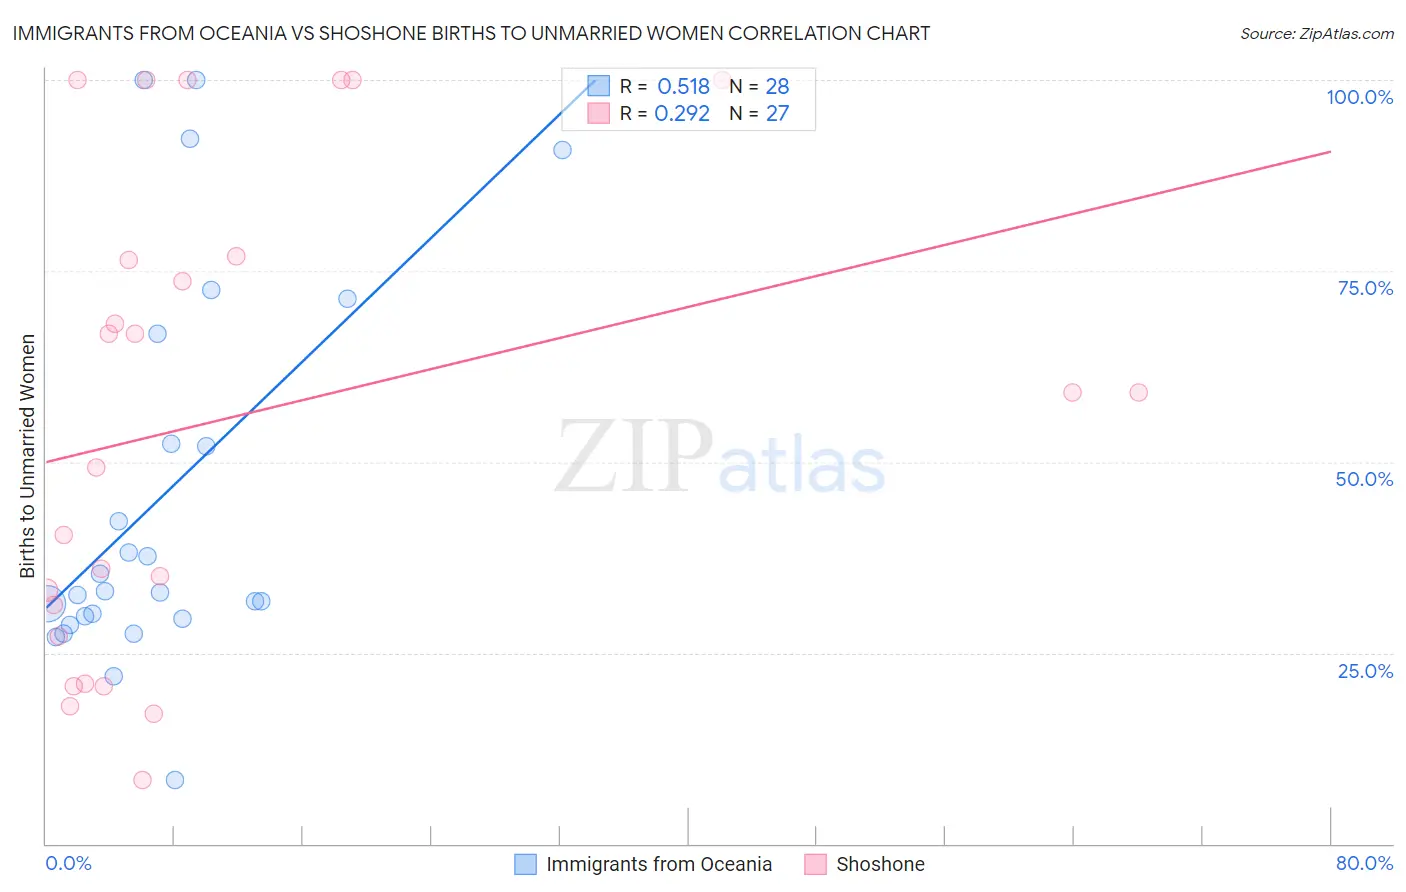
Immigrants from Oceania vs Shoshone Births to Unmarried Women Correlation Chart

The statistical analysis conducted on geographies consisting of 287,126,305 people shows a substantial positive correlation between the proportion of Immigrants from Oceania and percentage of births to unmarried women in the United States with a correlation coefficient (R) of 0.518 and weighted average of 30.6%. Similarly, the statistical analysis conducted on geographies consisting of 65,659,709 people shows a weak positive correlation between the proportion of Shoshone and percentage of births to unmarried women in the United States with a correlation coefficient (R) of 0.292 and weighted average of 35.3%, a difference of 15.4%.
Immigrants from Oceania vs Shoshone Births to Unmarried Women

Births to Unmarried Women Correlation Summary

MeasurementImmigrants from OceaniaShoshone
Minimum8.4%8.3%
Maximum100.0%100.0%
Range91.6%91.7%
Mean45.6%55.7%
Median33.0%59.1%
Interquartile 25% (IQ1)29.6%27.2%
Interquartile 75% (IQ3)59.6%76.9%
Interquartile Range (IQR)29.9%49.7%
Standard Deviation (Sample)25.4%31.1%
Standard Deviation (Population)24.9%30.6%

Similar Demographics by Births to Unmarried Women

Demographics Similar to Immigrants from Oceania by Births to Unmarried Women

In terms of births to unmarried women, the demographic groups most similar to Immigrants from Oceania are Northern European (30.6%, a difference of 0.030%), Immigrants from North America (30.6%, a difference of 0.050%), Czech (30.5%, a difference of 0.15%), Immigrants from Uganda (30.5%, a difference of 0.22%), and South African (30.5%, a difference of 0.24%).
DemographicsRating | RankBirths to Unmarried Women
Swiss
83.1
/100
|
#140
Excellent
30.5%
Pakistanis
83.0
/100
|
#141
Excellent
30.5%
South Africans
82.7
/100
|
#142
Excellent
30.5%
Immigrants | Uganda
82.6
/100
|
#143
Excellent
30.5%
Czechs
82.1
/100
|
#144
Excellent
30.5%
Immigrants | North America
81.5
/100
|
#145
Excellent
30.6%
Northern Europeans
81.4
/100
|
#146
Excellent
30.6%
Immigrants | Oceania
81.2
/100
|
#147
Excellent
30.6%
Chileans
79.1
/100
|
#148
Good
30.7%
Serbians
78.8
/100
|
#149
Good
30.7%
Somalis
77.8
/100
|
#150
Good
30.7%
Italians
77.0
/100
|
#151
Good
30.8%
Poles
76.2
/100
|
#152
Good
30.8%
British
76.0
/100
|
#153
Good
30.8%
Yugoslavians
75.1
/100
|
#154
Good
30.8%

Demographics Similar to Shoshone by Births to Unmarried Women

In terms of births to unmarried women, the demographic groups most similar to Shoshone are Nigerian (35.3%, a difference of 0.11%), Immigrants from Nigeria (35.4%, a difference of 0.32%), Guyanese (35.2%, a difference of 0.34%), Japanese (35.2%, a difference of 0.40%), and Nonimmigrants (35.5%, a difference of 0.65%).
DemographicsRating | RankBirths to Unmarried Women
Immigrants | Cambodia
1.6
/100
|
#238
Tragic
34.8%
Sierra Leoneans
1.4
/100
|
#239
Tragic
34.9%
Immigrants | Middle Africa
1.2
/100
|
#240
Tragic
34.9%
Immigrants | Guyana
1.2
/100
|
#241
Tragic
35.0%
Indonesians
1.2
/100
|
#242
Tragic
35.0%
Japanese
0.9
/100
|
#243
Tragic
35.2%
Guyanese
0.9
/100
|
#244
Tragic
35.2%
Shoshone
0.8
/100
|
#245
Tragic
35.3%
Nigerians
0.7
/100
|
#246
Tragic
35.3%
Immigrants | Nigeria
0.7
/100
|
#247
Tragic
35.4%
Immigrants | Nonimmigrants
0.6
/100
|
#248
Tragic
35.5%
Bermudans
0.6
/100
|
#249
Tragic
35.5%
Mexican American Indians
0.4
/100
|
#250
Tragic
35.7%
Immigrants | Western Africa
0.3
/100
|
#251
Tragic
36.0%
Salvadorans
0.3
/100
|
#252
Tragic
36.0%