Immigrants from North Macedonia vs Moroccan Family Households

COMPARE

Immigrants from North Macedonia
Race
Ancestry
AfghanAfricanAlaska NativeAlaskan AthabascanAlbanianAleutAlsatianAmericanApacheArabArapahoArgentineanArmenianAssyrian/Chaldean/SyriacAustralianAustrianBahamianBangladeshiBarbadianBasqueBelgianBelizeanBermudanBhutaneseBlackfeetBolivianBrazilianBritishBritish West IndianBulgarianBurmeseCajunCambodianCanadianCape VerdeanCarpatho RusynCelticCentral AmericanCentral American IndianCherokeeCheyenneChickasawChileanChineseChippewaChoctawColombianColvilleComancheCosta RicanCreeCreekCroatianCrowCubanCypriotCzechCzechoslovakianDanishDelawareDominicanDutchDutch West IndianEastern EuropeanEcuadorianEgyptianEnglishEstonianEthiopianEuropeanFijianFilipinoFinnishFrenchFrench American IndianFrench CanadianGermanGerman RussianGhanaianGreekGuamanian/ChamorroGuatemalanGuyaneseHaitianHmongHonduranHopiHoumaHungarianIcelanderIndian (Asian)IndonesianInupiatIranianIraqiIrishIroquoisIsraeliItalianJamaicanJapaneseJordanianKenyanKiowaKoreanLaotianLatvianLebaneseLiberianLithuanianLumbeeLuxembourgerMacedonianMalaysianMalteseMarshalleseMenomineeMexicanMexican American IndianMongolianNative HawaiianNavajoNepaleseNew ZealanderNicaraguanNigerianNorthern EuropeanNorwegianOkinawanOsageOttawaPaiutePakistaniPalestinianPanamanianParaguayanPennsylvania GermanPeruvianPimaPolishPortuguesePotawatomiPuebloPuerto RicanPuget Sound SalishRomanianRussianSalvadoranSamoanScandinavianScotch-IrishScottishSeminoleSenegaleseSerbianShoshoneSierra LeoneanSiouxSlavicSlovakSloveneSomaliSouth AfricanSouth AmericanSouth American IndianSoviet UnionSpaniardSpanishSpanish AmericanSpanish American IndianSri LankanSubsaharan AfricanSudaneseSwedishSwissSyrianTaiwaneseThaiTlingit-HaidaTohono O'OdhamTonganTrinidadian and TobagonianTsimshianTurkishU.S. Virgin IslanderUgandanUkrainianUruguayanUteVenezuelanVietnameseWelshWest IndianYakamaYaquiYugoslavianYumanYup'ikZimbabwean
Immigration
NonimmigrantsImmigrantsAfghanistanAfricaAlbaniaArgentinaArmeniaAsiaAustraliaAustriaBahamasBangladeshBarbadosBelarusBelgiumBelizeBoliviaBosnia and HerzegovinaBrazilBulgariaBurma/MyanmarCabo VerdeCambodiaCameroonCanadaCaribbeanCentral AmericaChileChinaColombiaCongoCosta RicaCroatiaCubaCzechoslovakiaDenmarkDominicaDominican RepublicEastern AfricaEastern AsiaEastern EuropeEcuadorEgyptEl SalvadorEnglandEritreaEthiopiaEuropeFijiFranceGermanyGhanaGreeceGrenadaGuatemalaGuyanaHaitiHondurasHong KongHungaryIndiaIndonesiaIranIraqIrelandIsraelItalyJamaicaJapanJordanKazakhstanKenyaKoreaKuwaitLaosLatin AmericaLatviaLebanonLiberiaLithuaniaMalaysiaMexicoMicronesiaMiddle AfricaMoldovaMoroccoNepalNetherlandsNicaraguaNigeriaNorth AmericaNorth MacedoniaNorthern AfricaNorthern EuropeNorwayOceaniaPakistanPanamaPeruPhilippinesPolandPortugalRomaniaRussiaSaudi ArabiaScotlandSenegalSerbiaSierra LeoneSingaporeSomaliaSouth AfricaSouth AmericaSouth Central AsiaSouth Eastern AsiaSouthern EuropeSpainSri LankaSt. Vincent and the GrenadinesSudanSwedenSwitzerlandSyriaTaiwanThailandTrinidad and TobagoTurkeyUgandaUkraineUruguayUzbekistanVenezuelaVietnamWest IndiesWestern AfricaWestern AsiaWestern EuropeYemenZaireZimbabweAzores
Moroccan
Race
Ancestry
AfghanAfricanAlaska NativeAlaskan AthabascanAlbanianAleutAlsatianAmericanApacheArabArapahoArgentineanArmenianAssyrian/Chaldean/SyriacAustralianAustrianBahamianBangladeshiBarbadianBasqueBelgianBelizeanBermudanBhutaneseBlackfeetBolivianBrazilianBritishBritish West IndianBulgarianBurmeseCajunCambodianCanadianCape VerdeanCarpatho RusynCelticCentral AmericanCentral American IndianCherokeeCheyenneChickasawChileanChineseChippewaChoctawColombianColvilleComancheCosta RicanCreeCreekCroatianCrowCubanCypriotCzechCzechoslovakianDanishDelawareDominicanDutchDutch West IndianEastern EuropeanEcuadorianEgyptianEnglishEstonianEthiopianEuropeanFijianFilipinoFinnishFrenchFrench American IndianFrench CanadianGermanGerman RussianGhanaianGreekGuamanian/ChamorroGuatemalanGuyaneseHaitianHmongHonduranHopiHoumaHungarianIcelanderIndian (Asian)IndonesianInupiatIranianIraqiIrishIroquoisIsraeliItalianJamaicanJapaneseJordanianKenyanKiowaKoreanLaotianLatvianLebaneseLiberianLithuanianLumbeeLuxembourgerMacedonianMalaysianMalteseMarshalleseMenomineeMexicanMexican American IndianMongolianMoroccanNative HawaiianNavajoNepaleseNew ZealanderNicaraguanNigerianNorthern EuropeanNorwegianOkinawanOsageOttawaPaiutePakistaniPalestinianPanamanianParaguayanPennsylvania GermanPeruvianPimaPolishPortuguesePotawatomiPuebloPuerto RicanPuget Sound SalishRomanianRussianSalvadoranSamoanScandinavianScotch-IrishScottishSeminoleSenegaleseSerbianShoshoneSierra LeoneanSiouxSlavicSlovakSloveneSomaliSouth AfricanSouth AmericanSouth American IndianSoviet UnionSpaniardSpanishSpanish AmericanSpanish American IndianSri LankanSubsaharan AfricanSudaneseSwedishSwissSyrianTaiwaneseThaiTlingit-HaidaTohono O'OdhamTonganTrinidadian and TobagonianTsimshianTurkishU.S. Virgin IslanderUgandanUkrainianUruguayanUteVenezuelanVietnameseWelshWest IndianYakamaYaquiYugoslavianYumanYup'ikZimbabwean
Immigration
NonimmigrantsImmigrantsAfghanistanAfricaAlbaniaArgentinaArmeniaAsiaAustraliaAustriaBahamasBangladeshBarbadosBelarusBelgiumBelizeBoliviaBosnia and HerzegovinaBrazilBulgariaBurma/MyanmarCabo VerdeCambodiaCameroonCanadaCaribbeanCentral AmericaChileChinaColombiaCongoCosta RicaCroatiaCubaCzechoslovakiaDenmarkDominicaDominican RepublicEastern AfricaEastern AsiaEastern EuropeEcuadorEgyptEl SalvadorEnglandEritreaEthiopiaEuropeFijiFranceGermanyGhanaGreeceGrenadaGuatemalaGuyanaHaitiHondurasHong KongHungaryIndiaIndonesiaIranIraqIrelandIsraelItalyJamaicaJapanJordanKazakhstanKenyaKoreaKuwaitLaosLatin AmericaLatviaLebanonLiberiaLithuaniaMalaysiaMexicoMicronesiaMiddle AfricaMoldovaMoroccoNepalNetherlandsNicaraguaNigeriaNorth AmericaNorthern AfricaNorthern EuropeNorwayOceaniaPakistanPanamaPeruPhilippinesPolandPortugalRomaniaRussiaSaudi ArabiaScotlandSenegalSerbiaSierra LeoneSingaporeSomaliaSouth AfricaSouth AmericaSouth Central AsiaSouth Eastern AsiaSouthern EuropeSpainSri LankaSt. Vincent and the GrenadinesSudanSwedenSwitzerlandSyriaTaiwanThailandTrinidad and TobagoTurkeyUgandaUkraineUruguayUzbekistanVenezuelaVietnamWest IndiesWestern AfricaWestern AsiaWestern EuropeYemenZaireZimbabweAzores
Family Households
Income
Poverty
Unemployment
Labor Participation
Family Structure
Vehicle Availability
Education Level
Disability

Family Households Comparison

Immigrants from North Macedonia

Moroccans

Excellent
Tragic
64.7%
FAMILY HOUSEHOLDS
84.9/ 100
METRIC RATING
140th/ 347
METRIC RANK
61.9%
FAMILY HOUSEHOLDS
0.0/ 100
METRIC RATING
315th/ 347
METRIC RANK

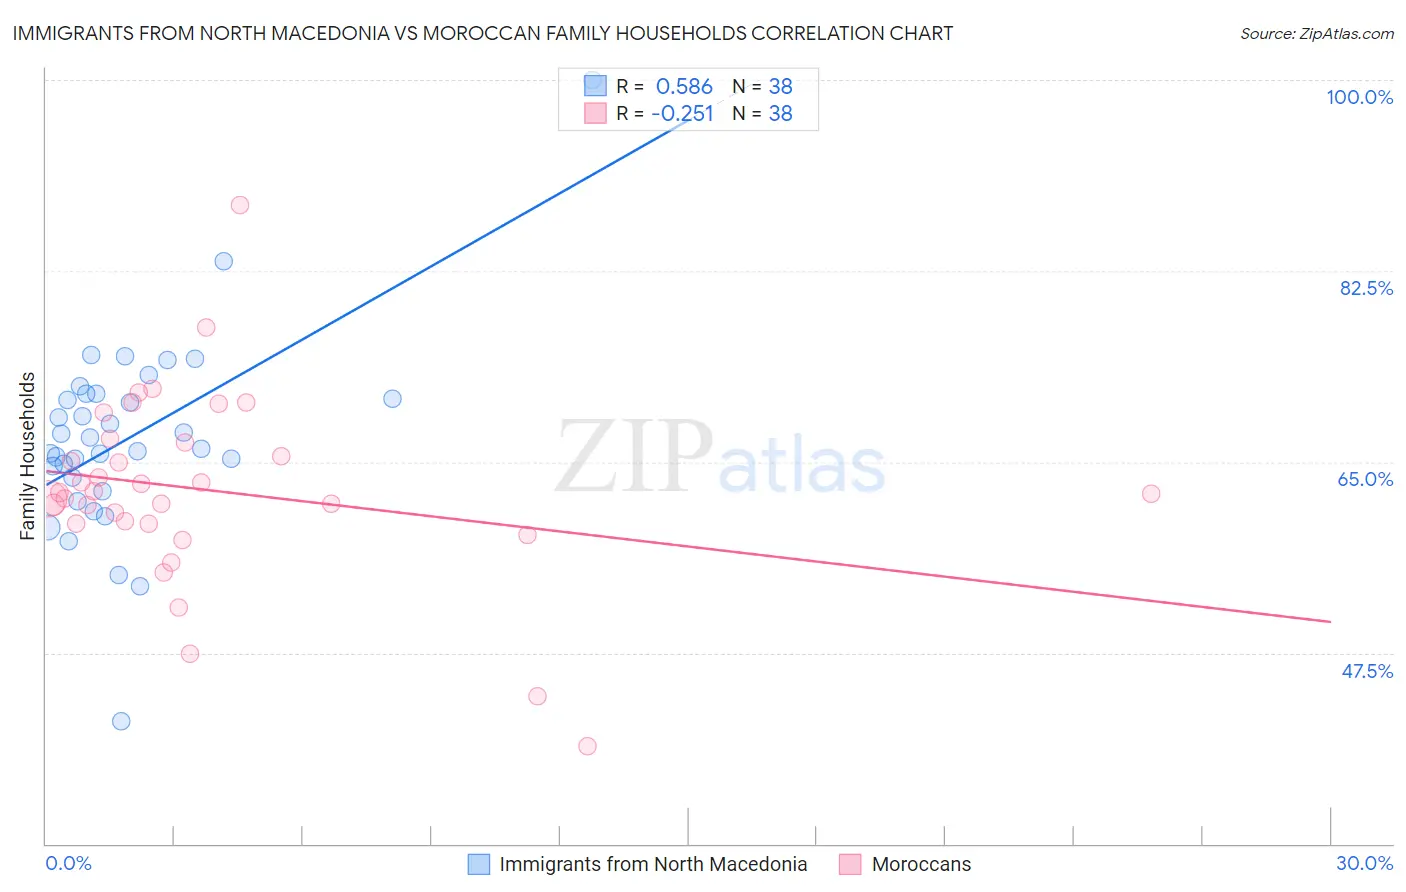
Immigrants from North Macedonia vs Moroccan Family Households Correlation Chart

The statistical analysis conducted on geographies consisting of 74,306,697 people shows a substantial positive correlation between the proportion of Immigrants from North Macedonia and percentage of family households in the United States with a correlation coefficient (R) of 0.586 and weighted average of 64.7%. Similarly, the statistical analysis conducted on geographies consisting of 201,760,179 people shows a weak negative correlation between the proportion of Moroccans and percentage of family households in the United States with a correlation coefficient (R) of -0.251 and weighted average of 61.9%, a difference of 4.4%.
Immigrants from North Macedonia vs Moroccan Family Households

Family Households Correlation Summary

MeasurementImmigrants from North MacedoniaMoroccan
Minimum41.2%38.9%
Maximum100.0%88.5%
Range58.8%49.6%
Mean67.2%62.4%
Median66.7%62.1%
Interquartile 25% (IQ1)63.5%59.3%
Interquartile 75% (IQ3)71.2%66.7%
Interquartile Range (IQR)7.7%7.4%
Standard Deviation (Sample)9.1%8.7%
Standard Deviation (Population)9.0%8.6%

Similar Demographics by Family Households

Demographics Similar to Immigrants from North Macedonia by Family Households

In terms of family households, the demographic groups most similar to Immigrants from North Macedonia are Immigrants from Cameroon (64.7%, a difference of 0.0%), Immigrants from Jamaica (64.7%, a difference of 0.010%), Basque (64.7%, a difference of 0.020%), Pakistani (64.7%, a difference of 0.020%), and Immigrants from China (64.7%, a difference of 0.040%).
DemographicsRating | RankFamily Households
Belizeans
89.3
/100
|
#133
Excellent
64.8%
Greeks
88.1
/100
|
#134
Excellent
64.7%
Maltese
87.4
/100
|
#135
Excellent
64.7%
Immigrants | China
86.6
/100
|
#136
Excellent
64.7%
Immigrants | Scotland
86.4
/100
|
#137
Excellent
64.7%
Basques
85.5
/100
|
#138
Excellent
64.7%
Immigrants | Jamaica
85.3
/100
|
#139
Excellent
64.7%
Immigrants | North Macedonia
84.9
/100
|
#140
Excellent
64.7%
Immigrants | Cameroon
84.8
/100
|
#141
Excellent
64.7%
Pakistanis
84.0
/100
|
#142
Excellent
64.7%
Czechoslovakians
82.1
/100
|
#143
Excellent
64.6%
South American Indians
81.9
/100
|
#144
Excellent
64.6%
Welsh
80.1
/100
|
#145
Excellent
64.6%
Immigrants | Romania
77.0
/100
|
#146
Good
64.6%
Immigrants | Chile
76.5
/100
|
#147
Good
64.6%

Demographics Similar to Moroccans by Family Households

In terms of family households, the demographic groups most similar to Moroccans are Immigrants from Cabo Verde (61.9%, a difference of 0.040%), Immigrants from Middle Africa (61.9%, a difference of 0.040%), Immigrants from Bosnia and Herzegovina (61.9%, a difference of 0.080%), Liberian (62.0%, a difference of 0.090%), and Immigrants from Latvia (62.0%, a difference of 0.10%).
DemographicsRating | RankFamily Households
Chippewa
0.0
/100
|
#308
Tragic
62.1%
Sub-Saharan Africans
0.0
/100
|
#309
Tragic
62.1%
Immigrants | Liberia
0.0
/100
|
#310
Tragic
62.0%
Immigrants | Morocco
0.0
/100
|
#311
Tragic
62.0%
Immigrants | Latvia
0.0
/100
|
#312
Tragic
62.0%
Liberians
0.0
/100
|
#313
Tragic
62.0%
Immigrants | Cabo Verde
0.0
/100
|
#314
Tragic
61.9%
Moroccans
0.0
/100
|
#315
Tragic
61.9%
Immigrants | Middle Africa
0.0
/100
|
#316
Tragic
61.9%
Immigrants | Bosnia and Herzegovina
0.0
/100
|
#317
Tragic
61.9%
Alaskan Athabascans
0.0
/100
|
#318
Tragic
61.8%
Cape Verdeans
0.0
/100
|
#319
Tragic
61.8%
Ugandans
0.0
/100
|
#320
Tragic
61.7%
Alsatians
0.0
/100
|
#321
Tragic
61.7%
Immigrants | Serbia
0.0
/100
|
#322
Tragic
61.6%