Immigrants from North America vs Immigrants from Belize Single Father Households
COMPARE
Immigrants from North America
Immigrants from Belize
Single Father Households
Single Father Households Comparison
Immigrants from North America
Immigrants from Belize
2.2%
SINGLE FATHER HOUSEHOLDS
98.2/ 100
METRIC RATING
114th/ 347
METRIC RANK
2.5%
SINGLE FATHER HOUSEHOLDS
0.9/ 100
METRIC RATING
261st/ 347
METRIC RANK
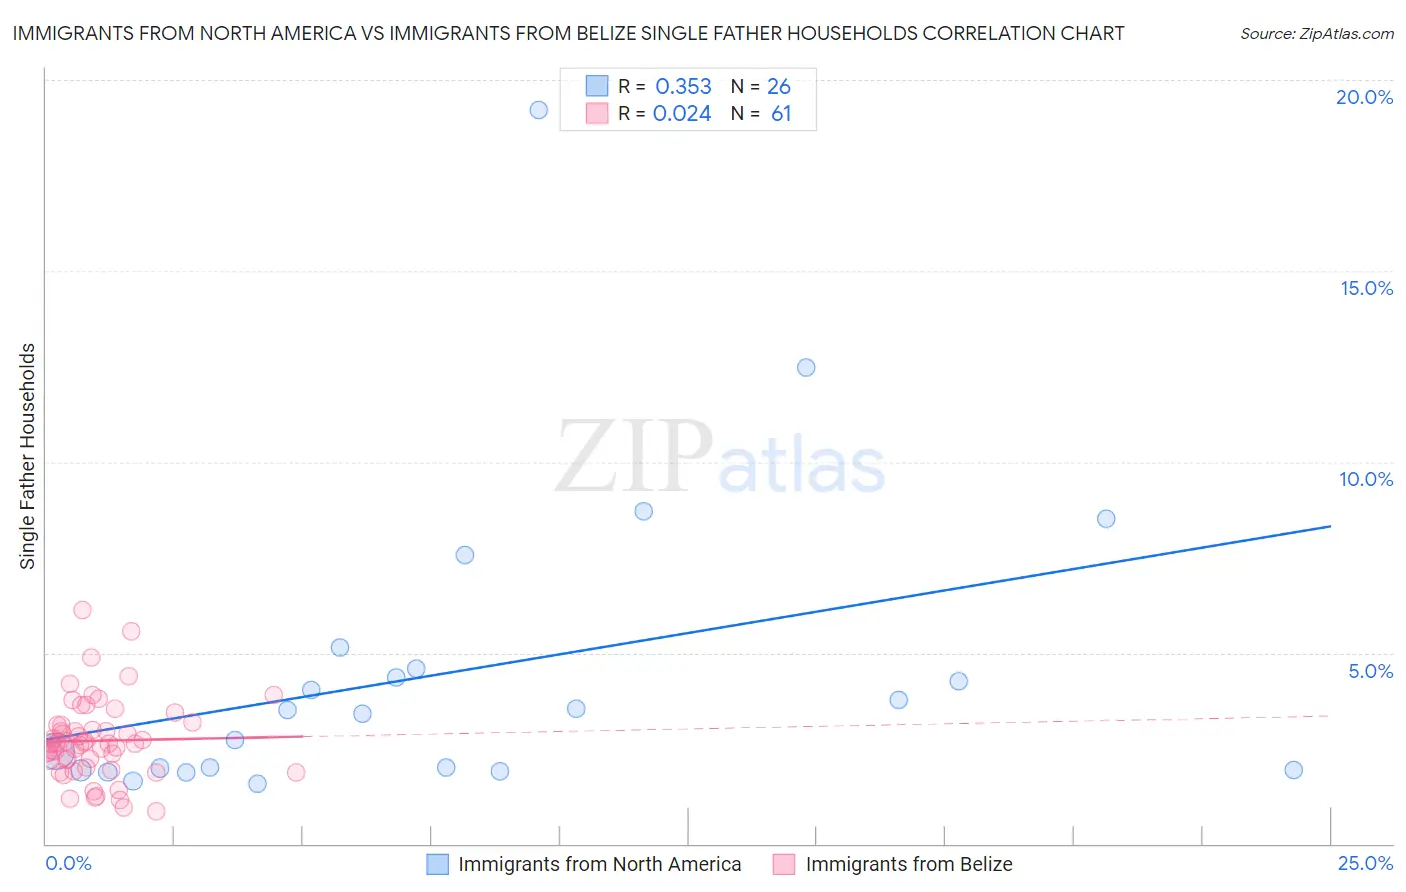
Immigrants from North America vs Immigrants from Belize Single Father Households Correlation Chart
The statistical analysis conducted on geographies consisting of 456,447,919 people shows a mild positive correlation between the proportion of Immigrants from North America and percentage of single father households in the United States with a correlation coefficient (R) of 0.353 and weighted average of 2.2%. Similarly, the statistical analysis conducted on geographies consisting of 129,846,095 people shows no correlation between the proportion of Immigrants from Belize and percentage of single father households in the United States with a correlation coefficient (R) of 0.024 and weighted average of 2.5%, a difference of 17.2%.
Single Father Households Correlation Summary
| Measurement | Immigrants from North America | Immigrants from Belize |
| Minimum | 1.6% | 0.87% |
| Maximum | 19.2% | 6.1% |
| Range | 17.6% | 5.3% |
| Mean | 4.5% | 2.7% |
| Median | 3.4% | 2.6% |
| Interquartile 25% (IQ1) | 1.9% | 2.1% |
| Interquartile 75% (IQ3) | 4.6% | 3.1% |
| Interquartile Range (IQR) | 2.6% | 1.0% |
| Standard Deviation (Sample) | 4.0% | 1.0% |
| Standard Deviation (Population) | 3.9% | 1.0% |
Similar Demographics by Single Father Households
Demographics Similar to Immigrants from North America by Single Father Households
In terms of single father households, the demographic groups most similar to Immigrants from North America are Immigrants from Barbados (2.2%, a difference of 0.030%), Iraqi (2.2%, a difference of 0.040%), Immigrants from Trinidad and Tobago (2.2%, a difference of 0.060%), Immigrants from Argentina (2.2%, a difference of 0.060%), and Immigrants from Canada (2.2%, a difference of 0.090%).
| Demographics | Rating | Rank | Single Father Households |
| Slovenes | 98.5 /100 | #107 | Exceptional 2.2% |
| Immigrants | Netherlands | 98.5 /100 | #108 | Exceptional 2.2% |
| Barbadians | 98.4 /100 | #109 | Exceptional 2.2% |
| Italians | 98.3 /100 | #110 | Exceptional 2.2% |
| Immigrants | Canada | 98.3 /100 | #111 | Exceptional 2.2% |
| Immigrants | Trinidad and Tobago | 98.2 /100 | #112 | Exceptional 2.2% |
| Iraqis | 98.2 /100 | #113 | Exceptional 2.2% |
| Immigrants | North America | 98.2 /100 | #114 | Exceptional 2.2% |
| Immigrants | Barbados | 98.2 /100 | #115 | Exceptional 2.2% |
| Immigrants | Argentina | 98.1 /100 | #116 | Exceptional 2.2% |
| Hungarians | 97.9 /100 | #117 | Exceptional 2.2% |
| Immigrants | Morocco | 97.8 /100 | #118 | Exceptional 2.2% |
| Trinidadians and Tobagonians | 97.8 /100 | #119 | Exceptional 2.2% |
| Australians | 97.7 /100 | #120 | Exceptional 2.2% |
| Immigrants | Brazil | 97.7 /100 | #121 | Exceptional 2.2% |
Demographics Similar to Immigrants from Belize by Single Father Households
In terms of single father households, the demographic groups most similar to Immigrants from Belize are Immigrants from Liberia (2.5%, a difference of 0.15%), Immigrants from Caribbean (2.5%, a difference of 0.16%), Comanche (2.5%, a difference of 0.25%), Dominican (2.5%, a difference of 0.28%), and Spanish (2.5%, a difference of 0.40%).
| Demographics | Rating | Rank | Single Father Households |
| Immigrants | Thailand | 1.8 /100 | #254 | Tragic 2.5% |
| Tongans | 1.5 /100 | #255 | Tragic 2.5% |
| Potawatomi | 1.4 /100 | #256 | Tragic 2.5% |
| Immigrants | Congo | 1.2 /100 | #257 | Tragic 2.5% |
| Spanish | 1.1 /100 | #258 | Tragic 2.5% |
| Comanche | 1.0 /100 | #259 | Tragic 2.5% |
| Immigrants | Caribbean | 1.0 /100 | #260 | Tragic 2.5% |
| Immigrants | Belize | 0.9 /100 | #261 | Tragic 2.5% |
| Immigrants | Liberia | 0.8 /100 | #262 | Tragic 2.5% |
| Dominicans | 0.8 /100 | #263 | Tragic 2.5% |
| Indonesians | 0.5 /100 | #264 | Tragic 2.6% |
| Immigrants | Micronesia | 0.5 /100 | #265 | Tragic 2.6% |
| French American Indians | 0.5 /100 | #266 | Tragic 2.6% |
| Guamanians/Chamorros | 0.4 /100 | #267 | Tragic 2.6% |
| Haitians | 0.4 /100 | #268 | Tragic 2.6% |