Immigrants from Nigeria vs Immigrants from Haiti Currently Married
COMPARE
Immigrants from Nigeria
Immigrants from Haiti
Currently Married
Currently Married Comparison
Immigrants from Nigeria
Immigrants from Haiti
43.4%
CURRENTLY MARRIED
0.1/ 100
METRIC RATING
277th/ 347
METRIC RANK
41.0%
CURRENTLY MARRIED
0.0/ 100
METRIC RATING
322nd/ 347
METRIC RANK
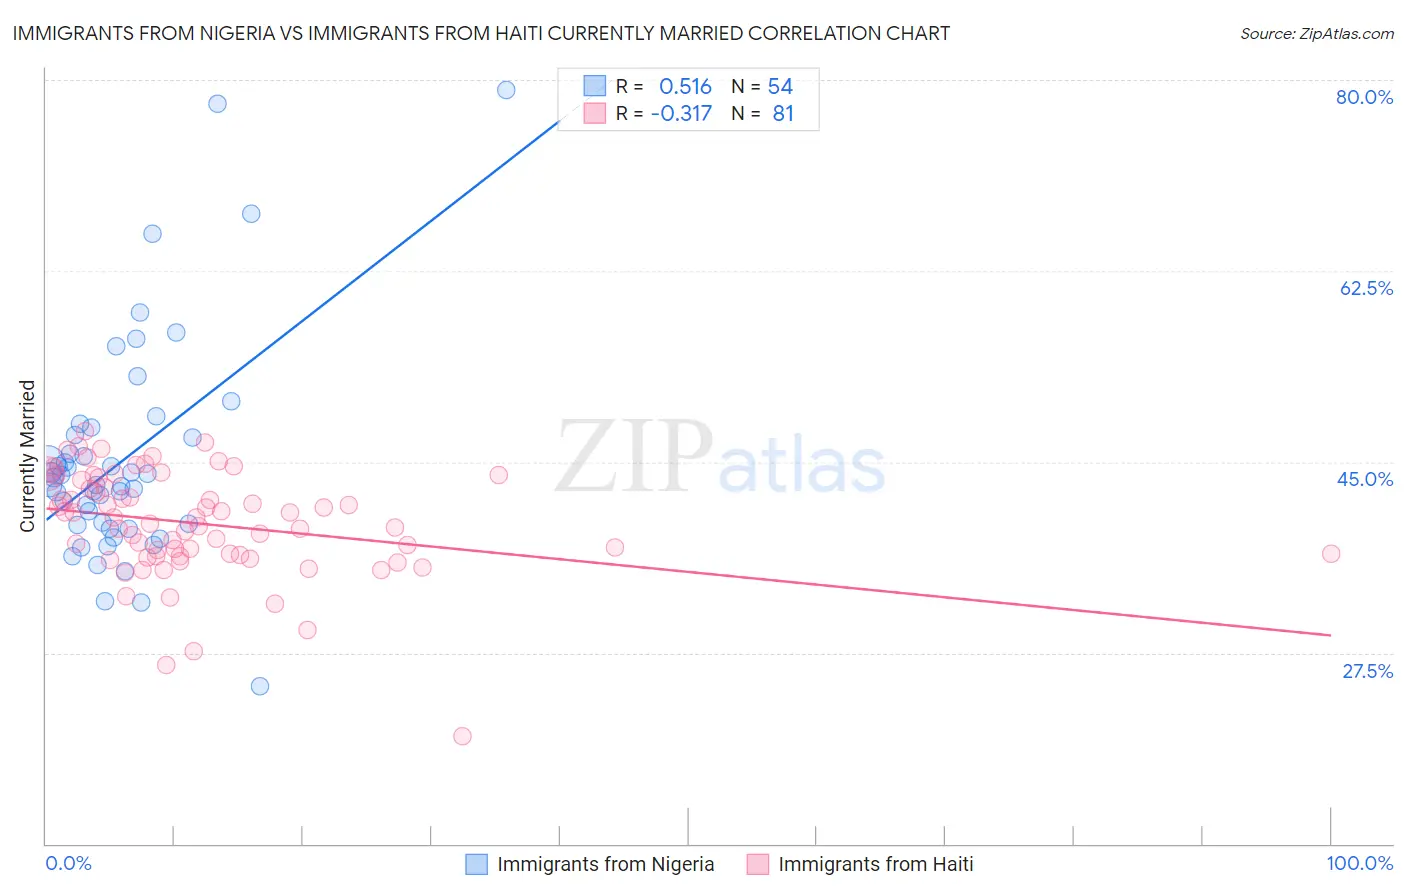
Immigrants from Nigeria vs Immigrants from Haiti Currently Married Correlation Chart
The statistical analysis conducted on geographies consisting of 283,441,157 people shows a substantial positive correlation between the proportion of Immigrants from Nigeria and percentage of population currently married in the United States with a correlation coefficient (R) of 0.516 and weighted average of 43.4%. Similarly, the statistical analysis conducted on geographies consisting of 225,264,174 people shows a mild negative correlation between the proportion of Immigrants from Haiti and percentage of population currently married in the United States with a correlation coefficient (R) of -0.317 and weighted average of 41.0%, a difference of 5.9%.
Currently Married Correlation Summary
| Measurement | Immigrants from Nigeria | Immigrants from Haiti |
| Minimum | 24.4% | 19.9% |
| Maximum | 79.1% | 47.8% |
| Range | 54.7% | 27.9% |
| Mean | 45.1% | 39.3% |
| Median | 43.2% | 39.9% |
| Interquartile 25% (IQ1) | 39.2% | 36.4% |
| Interquartile 75% (IQ3) | 47.4% | 43.5% |
| Interquartile Range (IQR) | 8.3% | 7.1% |
| Standard Deviation (Sample) | 10.2% | 4.9% |
| Standard Deviation (Population) | 10.1% | 4.9% |
Similar Demographics by Currently Married
Demographics Similar to Immigrants from Nigeria by Currently Married
In terms of currently married, the demographic groups most similar to Immigrants from Nigeria are Sierra Leonean (43.4%, a difference of 0.010%), Colville (43.4%, a difference of 0.040%), Nigerian (43.4%, a difference of 0.060%), Yaqui (43.4%, a difference of 0.070%), and Indonesian (43.5%, a difference of 0.12%).
| Demographics | Rating | Rank | Currently Married |
| Salvadorans | 0.1 /100 | #270 | Tragic 43.5% |
| Bermudans | 0.1 /100 | #271 | Tragic 43.5% |
| Indonesians | 0.1 /100 | #272 | Tragic 43.5% |
| Yaqui | 0.1 /100 | #273 | Tragic 43.4% |
| Nigerians | 0.1 /100 | #274 | Tragic 43.4% |
| Colville | 0.1 /100 | #275 | Tragic 43.4% |
| Sierra Leoneans | 0.1 /100 | #276 | Tragic 43.4% |
| Immigrants | Nigeria | 0.1 /100 | #277 | Tragic 43.4% |
| Central Americans | 0.0 /100 | #278 | Tragic 43.3% |
| Central American Indians | 0.0 /100 | #279 | Tragic 43.3% |
| Apache | 0.0 /100 | #280 | Tragic 43.2% |
| Chippewa | 0.0 /100 | #281 | Tragic 43.2% |
| Immigrants | Ecuador | 0.0 /100 | #282 | Tragic 43.2% |
| Kiowa | 0.0 /100 | #283 | Tragic 43.2% |
| Immigrants | El Salvador | 0.0 /100 | #284 | Tragic 43.1% |
Demographics Similar to Immigrants from Haiti by Currently Married
In terms of currently married, the demographic groups most similar to Immigrants from Haiti are Immigrants from Congo (41.1%, a difference of 0.13%), Immigrants from Jamaica (41.1%, a difference of 0.36%), Immigrants from Somalia (41.2%, a difference of 0.43%), Bahamian (41.2%, a difference of 0.44%), and Haitian (41.3%, a difference of 0.63%).
| Demographics | Rating | Rank | Currently Married |
| Inupiat | 0.0 /100 | #315 | Tragic 41.3% |
| Immigrants | Caribbean | 0.0 /100 | #316 | Tragic 41.3% |
| Haitians | 0.0 /100 | #317 | Tragic 41.3% |
| Bahamians | 0.0 /100 | #318 | Tragic 41.2% |
| Immigrants | Somalia | 0.0 /100 | #319 | Tragic 41.2% |
| Immigrants | Jamaica | 0.0 /100 | #320 | Tragic 41.1% |
| Immigrants | Congo | 0.0 /100 | #321 | Tragic 41.1% |
| Immigrants | Haiti | 0.0 /100 | #322 | Tragic 41.0% |
| Immigrants | West Indies | 0.0 /100 | #323 | Tragic 40.7% |
| Immigrants | Senegal | 0.0 /100 | #324 | Tragic 40.7% |
| U.S. Virgin Islanders | 0.0 /100 | #325 | Tragic 40.7% |
| Barbadians | 0.0 /100 | #326 | Tragic 40.6% |
| Senegalese | 0.0 /100 | #327 | Tragic 40.6% |
| Arapaho | 0.0 /100 | #328 | Tragic 40.5% |
| Crow | 0.0 /100 | #329 | Tragic 40.4% |