Immigrants from Nigeria vs Ethiopian Divorced or Separated
COMPARE
Immigrants from Nigeria
Ethiopian
Divorced or Separated
Divorced or Separated Comparison
Immigrants from Nigeria
Ethiopians
12.1%
DIVORCED OR SEPARATED
40.5/ 100
METRIC RATING
185th/ 347
METRIC RANK
12.0%
DIVORCED OR SEPARATED
58.5/ 100
METRIC RATING
167th/ 347
METRIC RANK
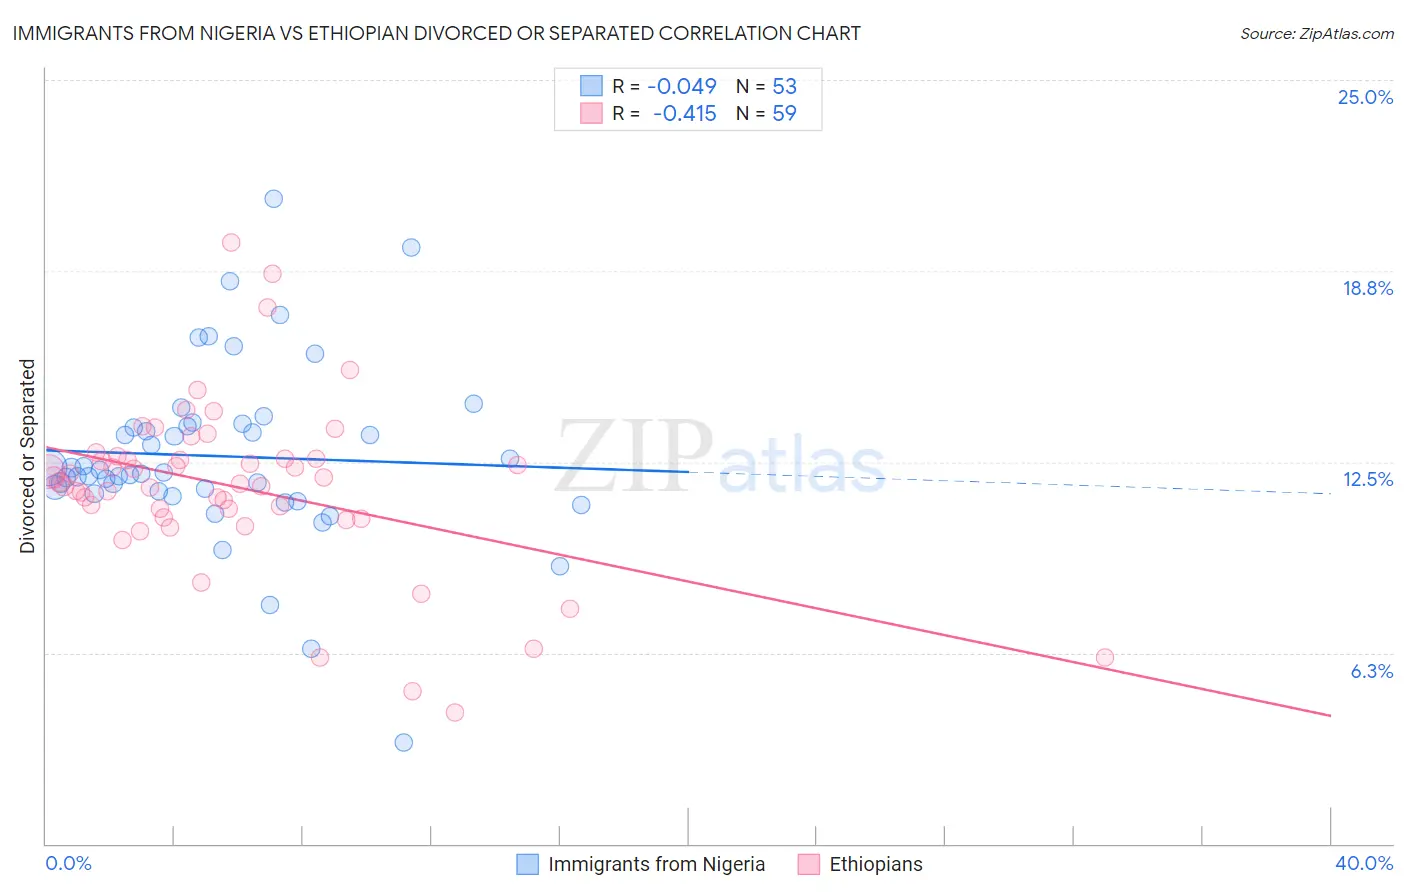
Immigrants from Nigeria vs Ethiopian Divorced or Separated Correlation Chart
The statistical analysis conducted on geographies consisting of 283,324,387 people shows no correlation between the proportion of Immigrants from Nigeria and percentage of population currently divorced or separated in the United States with a correlation coefficient (R) of -0.049 and weighted average of 12.1%. Similarly, the statistical analysis conducted on geographies consisting of 223,166,328 people shows a moderate negative correlation between the proportion of Ethiopians and percentage of population currently divorced or separated in the United States with a correlation coefficient (R) of -0.415 and weighted average of 12.0%, a difference of 0.63%.
Divorced or Separated Correlation Summary
| Measurement | Immigrants from Nigeria | Ethiopian |
| Minimum | 3.3% | 4.3% |
| Maximum | 21.1% | 19.7% |
| Range | 17.8% | 15.4% |
| Mean | 12.7% | 11.7% |
| Median | 12.2% | 11.8% |
| Interquartile 25% (IQ1) | 11.5% | 10.7% |
| Interquartile 75% (IQ3) | 13.7% | 12.6% |
| Interquartile Range (IQR) | 2.2% | 1.9% |
| Standard Deviation (Sample) | 2.9% | 2.8% |
| Standard Deviation (Population) | 2.9% | 2.8% |
Demographics Similar to Immigrants from Nigeria and Ethiopians by Divorced or Separated
In terms of divorced or separated, the demographic groups most similar to Immigrants from Nigeria are Immigrants from North America (12.1%, a difference of 0.020%), Immigrants from Chile (12.1%, a difference of 0.050%), Immigrants from Ethiopia (12.1%, a difference of 0.090%), Immigrants from Central America (12.1%, a difference of 0.090%), and Immigrants from Canada (12.1%, a difference of 0.12%). Similarly, the demographic groups most similar to Ethiopians are Serbian (12.0%, a difference of 0.050%), Immigrants from Peru (12.0%, a difference of 0.050%), Tohono O'odham (12.0%, a difference of 0.070%), Mexican American Indian (12.0%, a difference of 0.10%), and Costa Rican (12.0%, a difference of 0.18%).
| Demographics | Rating | Rank | Divorced or Separated |
| Tohono O'odham | 60.4 /100 | #166 | Good 12.0% |
| Ethiopians | 58.5 /100 | #167 | Average 12.0% |
| Serbians | 57.1 /100 | #168 | Average 12.0% |
| Immigrants | Peru | 57.0 /100 | #169 | Average 12.0% |
| Mexican American Indians | 55.8 /100 | #170 | Average 12.0% |
| Costa Ricans | 53.3 /100 | #171 | Average 12.0% |
| Immigrants | Mexico | 53.2 /100 | #172 | Average 12.0% |
| Immigrants | Moldova | 50.4 /100 | #173 | Average 12.1% |
| Hawaiians | 50.0 /100 | #174 | Average 12.1% |
| Immigrants | Sierra Leone | 50.0 /100 | #175 | Average 12.1% |
| Pennsylvania Germans | 48.9 /100 | #176 | Average 12.1% |
| Brazilians | 47.7 /100 | #177 | Average 12.1% |
| Ghanaians | 45.9 /100 | #178 | Average 12.1% |
| Immigrants | Western Europe | 45.6 /100 | #179 | Average 12.1% |
| Barbadians | 45.0 /100 | #180 | Average 12.1% |
| Immigrants | Canada | 44.0 /100 | #181 | Average 12.1% |
| Immigrants | Ethiopia | 43.1 /100 | #182 | Average 12.1% |
| Immigrants | Central America | 42.9 /100 | #183 | Average 12.1% |
| Immigrants | North America | 41.1 /100 | #184 | Average 12.1% |
| Immigrants | Nigeria | 40.5 /100 | #185 | Average 12.1% |
| Immigrants | Chile | 39.0 /100 | #186 | Fair 12.1% |