Immigrants from Middle Africa vs Immigrants from North Macedonia Currently Married
COMPARE
Immigrants from Middle Africa
Immigrants from North Macedonia
Currently Married
Currently Married Comparison
Immigrants from Middle Africa
Immigrants from North Macedonia
43.0%
CURRENTLY MARRIED
0.0/ 100
METRIC RATING
285th/ 347
METRIC RANK
48.5%
CURRENTLY MARRIED
98.7/ 100
METRIC RATING
55th/ 347
METRIC RANK
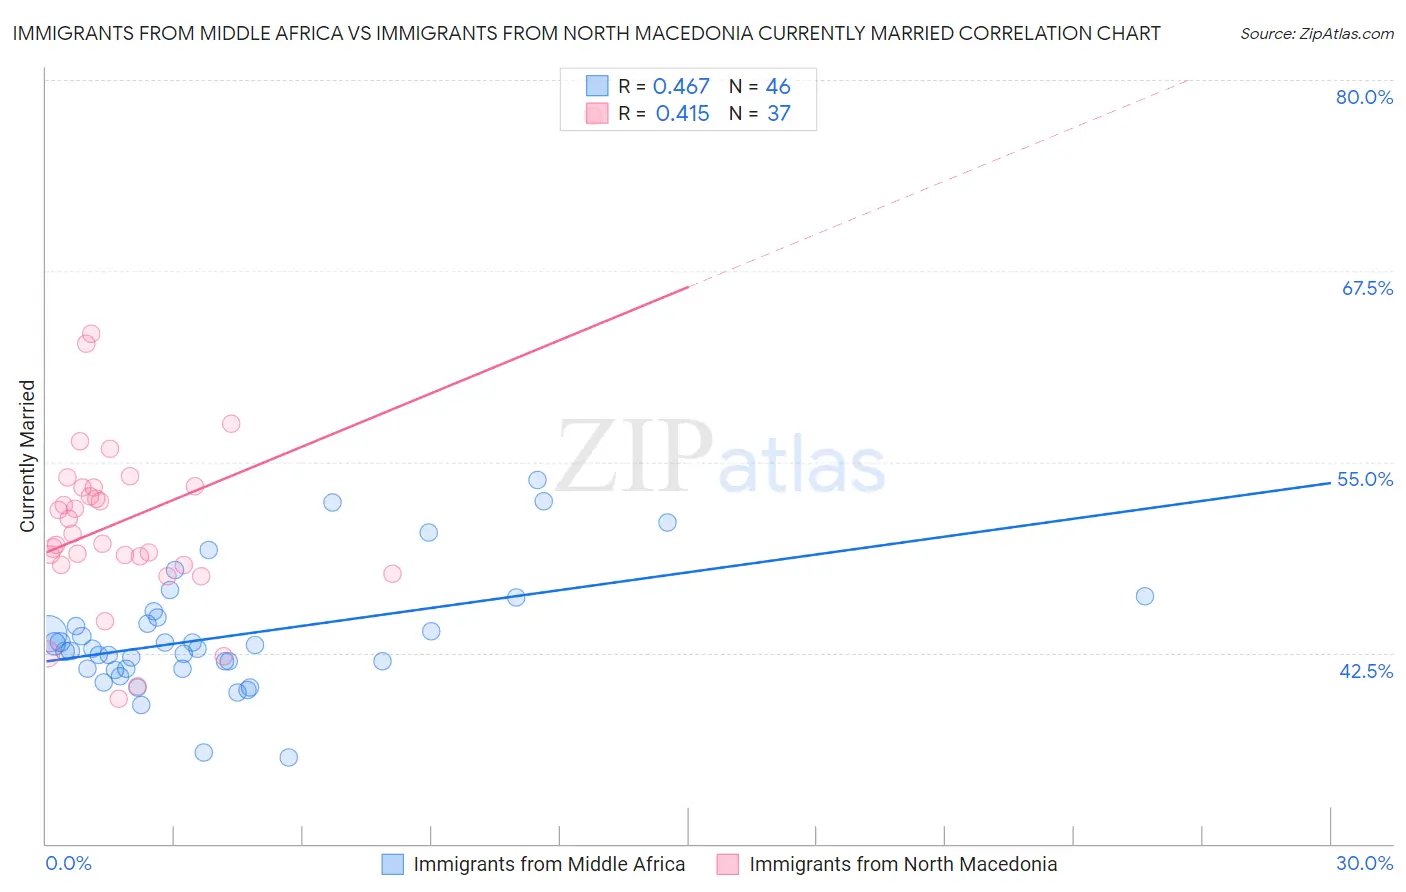
Immigrants from Middle Africa vs Immigrants from North Macedonia Currently Married Correlation Chart
The statistical analysis conducted on geographies consisting of 202,724,037 people shows a moderate positive correlation between the proportion of Immigrants from Middle Africa and percentage of population currently married in the United States with a correlation coefficient (R) of 0.467 and weighted average of 43.0%. Similarly, the statistical analysis conducted on geographies consisting of 74,297,543 people shows a moderate positive correlation between the proportion of Immigrants from North Macedonia and percentage of population currently married in the United States with a correlation coefficient (R) of 0.415 and weighted average of 48.5%, a difference of 12.8%.
Currently Married Correlation Summary
| Measurement | Immigrants from Middle Africa | Immigrants from North Macedonia |
| Minimum | 35.6% | 39.5% |
| Maximum | 53.8% | 77.6% |
| Range | 18.2% | 38.1% |
| Mean | 43.6% | 51.3% |
| Median | 42.8% | 50.3% |
| Interquartile 25% (IQ1) | 41.4% | 48.3% |
| Interquartile 75% (IQ3) | 44.8% | 53.4% |
| Interquartile Range (IQR) | 3.4% | 5.1% |
| Standard Deviation (Sample) | 3.9% | 6.8% |
| Standard Deviation (Population) | 3.8% | 6.7% |
Similar Demographics by Currently Married
Demographics Similar to Immigrants from Middle Africa by Currently Married
In terms of currently married, the demographic groups most similar to Immigrants from Middle Africa are Ghanaian (42.9%, a difference of 0.13%), Guatemalan (42.9%, a difference of 0.15%), Kiowa (43.2%, a difference of 0.40%), Immigrants from El Salvador (43.1%, a difference of 0.40%), and Native/Alaskan (42.8%, a difference of 0.42%).
| Demographics | Rating | Rank | Currently Married |
| Central Americans | 0.0 /100 | #278 | Tragic 43.3% |
| Central American Indians | 0.0 /100 | #279 | Tragic 43.3% |
| Apache | 0.0 /100 | #280 | Tragic 43.2% |
| Chippewa | 0.0 /100 | #281 | Tragic 43.2% |
| Immigrants | Ecuador | 0.0 /100 | #282 | Tragic 43.2% |
| Kiowa | 0.0 /100 | #283 | Tragic 43.2% |
| Immigrants | El Salvador | 0.0 /100 | #284 | Tragic 43.1% |
| Immigrants | Middle Africa | 0.0 /100 | #285 | Tragic 43.0% |
| Ghanaians | 0.0 /100 | #286 | Tragic 42.9% |
| Guatemalans | 0.0 /100 | #287 | Tragic 42.9% |
| Natives/Alaskans | 0.0 /100 | #288 | Tragic 42.8% |
| Paiute | 0.0 /100 | #289 | Tragic 42.7% |
| Immigrants | Ghana | 0.0 /100 | #290 | Tragic 42.7% |
| Immigrants | Guatemala | 0.0 /100 | #291 | Tragic 42.6% |
| Sub-Saharan Africans | 0.0 /100 | #292 | Tragic 42.6% |
Demographics Similar to Immigrants from North Macedonia by Currently Married
In terms of currently married, the demographic groups most similar to Immigrants from North Macedonia are Immigrants from Moldova (48.5%, a difference of 0.0%), Latvian (48.5%, a difference of 0.0%), Immigrants from Netherlands (48.5%, a difference of 0.030%), Immigrants from Austria (48.5%, a difference of 0.070%), and French (48.4%, a difference of 0.070%).
| Demographics | Rating | Rank | Currently Married |
| Austrians | 99.2 /100 | #48 | Exceptional 48.7% |
| Bhutanese | 99.1 /100 | #49 | Exceptional 48.6% |
| Iranians | 99.0 /100 | #50 | Exceptional 48.6% |
| Whites/Caucasians | 99.0 /100 | #51 | Exceptional 48.6% |
| Russians | 98.9 /100 | #52 | Exceptional 48.6% |
| Immigrants | Austria | 98.8 /100 | #53 | Exceptional 48.5% |
| Immigrants | Moldova | 98.7 /100 | #54 | Exceptional 48.5% |
| Immigrants | North Macedonia | 98.7 /100 | #55 | Exceptional 48.5% |
| Latvians | 98.7 /100 | #56 | Exceptional 48.5% |
| Immigrants | Netherlands | 98.6 /100 | #57 | Exceptional 48.5% |
| French | 98.6 /100 | #58 | Exceptional 48.4% |
| Immigrants | Ireland | 98.5 /100 | #59 | Exceptional 48.4% |
| Immigrants | Romania | 98.5 /100 | #60 | Exceptional 48.4% |
| Romanians | 98.5 /100 | #61 | Exceptional 48.4% |
| Asians | 98.5 /100 | #62 | Exceptional 48.4% |