Immigrants from Korea vs Immigrants from Philippines Currently Married
COMPARE
Immigrants from Korea
Immigrants from Philippines
Currently Married
Currently Married Comparison
Immigrants from Korea
Immigrants from Philippines
49.0%
CURRENTLY MARRIED
99.6/ 100
METRIC RATING
26th/ 347
METRIC RANK
47.6%
CURRENTLY MARRIED
90.2/ 100
METRIC RATING
118th/ 347
METRIC RANK
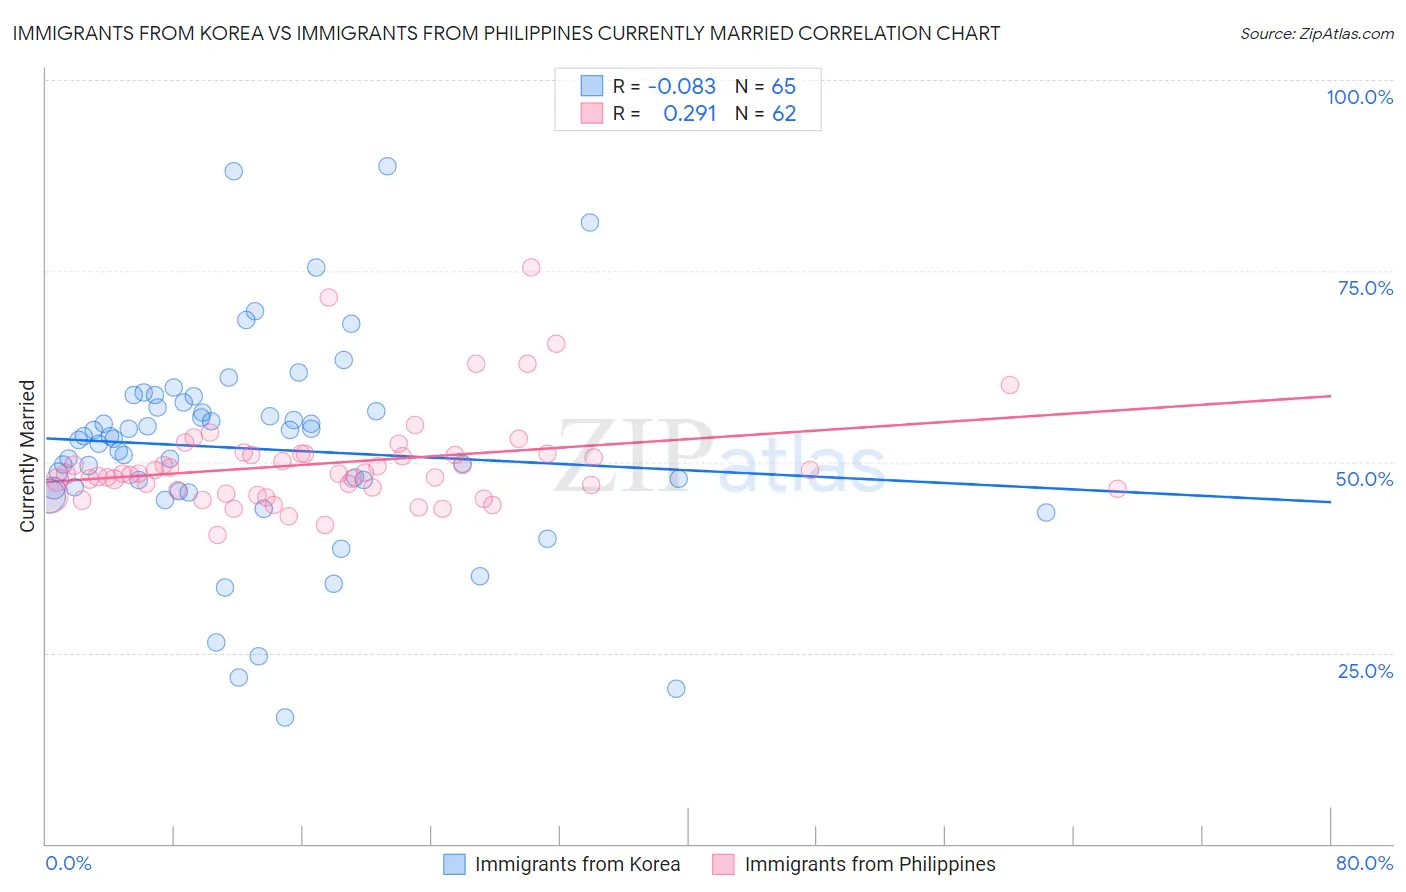
Immigrants from Korea vs Immigrants from Philippines Currently Married Correlation Chart
The statistical analysis conducted on geographies consisting of 416,263,579 people shows a slight negative correlation between the proportion of Immigrants from Korea and percentage of population currently married in the United States with a correlation coefficient (R) of -0.083 and weighted average of 49.0%. Similarly, the statistical analysis conducted on geographies consisting of 471,263,623 people shows a weak positive correlation between the proportion of Immigrants from Philippines and percentage of population currently married in the United States with a correlation coefficient (R) of 0.291 and weighted average of 47.6%, a difference of 2.9%.
Currently Married Correlation Summary
| Measurement | Immigrants from Korea | Immigrants from Philippines |
| Minimum | 16.6% | 40.5% |
| Maximum | 88.7% | 75.5% |
| Range | 72.1% | 35.0% |
| Mean | 51.8% | 49.8% |
| Median | 53.0% | 48.4% |
| Interquartile 25% (IQ1) | 46.4% | 46.4% |
| Interquartile 75% (IQ3) | 57.5% | 51.0% |
| Interquartile Range (IQR) | 11.1% | 4.6% |
| Standard Deviation (Sample) | 13.7% | 6.4% |
| Standard Deviation (Population) | 13.6% | 6.4% |
Similar Demographics by Currently Married
Demographics Similar to Immigrants from Korea by Currently Married
In terms of currently married, the demographic groups most similar to Immigrants from Korea are Maltese (49.0%, a difference of 0.050%), Lithuanian (49.0%, a difference of 0.060%), Burmese (48.9%, a difference of 0.070%), Welsh (48.9%, a difference of 0.11%), and Croatian (48.9%, a difference of 0.15%).
| Demographics | Rating | Rank | Currently Married |
| Europeans | 99.8 /100 | #19 | Exceptional 49.3% |
| Luxembourgers | 99.8 /100 | #20 | Exceptional 49.3% |
| Scottish | 99.8 /100 | #21 | Exceptional 49.2% |
| Bulgarians | 99.7 /100 | #22 | Exceptional 49.1% |
| Immigrants | Pakistan | 99.7 /100 | #23 | Exceptional 49.1% |
| Lithuanians | 99.6 /100 | #24 | Exceptional 49.0% |
| Maltese | 99.6 /100 | #25 | Exceptional 49.0% |
| Immigrants | Korea | 99.6 /100 | #26 | Exceptional 49.0% |
| Burmese | 99.6 /100 | #27 | Exceptional 48.9% |
| Welsh | 99.5 /100 | #28 | Exceptional 48.9% |
| Croatians | 99.5 /100 | #29 | Exceptional 48.9% |
| Eastern Europeans | 99.5 /100 | #30 | Exceptional 48.9% |
| Poles | 99.5 /100 | #31 | Exceptional 48.9% |
| Immigrants | Hong Kong | 99.5 /100 | #32 | Exceptional 48.9% |
| Irish | 99.5 /100 | #33 | Exceptional 48.9% |
Demographics Similar to Immigrants from Philippines by Currently Married
In terms of currently married, the demographic groups most similar to Immigrants from Philippines are Australian (47.6%, a difference of 0.0%), Puget Sound Salish (47.6%, a difference of 0.010%), Palestinian (47.6%, a difference of 0.020%), South African (47.6%, a difference of 0.030%), and Immigrants from Indonesia (47.6%, a difference of 0.030%).
| Demographics | Rating | Rank | Currently Married |
| Immigrants | Hungary | 91.2 /100 | #111 | Exceptional 47.6% |
| Immigrants | Western Europe | 91.1 /100 | #112 | Exceptional 47.6% |
| Immigrants | Denmark | 90.9 /100 | #113 | Exceptional 47.6% |
| South Africans | 90.5 /100 | #114 | Exceptional 47.6% |
| Immigrants | Indonesia | 90.5 /100 | #115 | Exceptional 47.6% |
| Palestinians | 90.4 /100 | #116 | Exceptional 47.6% |
| Puget Sound Salish | 90.3 /100 | #117 | Exceptional 47.6% |
| Immigrants | Philippines | 90.2 /100 | #118 | Exceptional 47.6% |
| Australians | 90.2 /100 | #119 | Exceptional 47.6% |
| Syrians | 88.9 /100 | #120 | Excellent 47.5% |
| Immigrants | Croatia | 88.6 /100 | #121 | Excellent 47.5% |
| Osage | 87.9 /100 | #122 | Excellent 47.5% |
| Immigrants | Kazakhstan | 87.2 /100 | #123 | Excellent 47.4% |
| Laotians | 86.6 /100 | #124 | Excellent 47.4% |
| Okinawans | 85.3 /100 | #125 | Excellent 47.4% |