Immigrants from Kazakhstan vs Alaska Native Single Father Households
COMPARE
Immigrants from Kazakhstan
Alaska Native
Single Father Households
Single Father Households Comparison
Immigrants from Kazakhstan
Alaska Natives
2.0%
SINGLE FATHER HOUSEHOLDS
99.9/ 100
METRIC RATING
48th/ 347
METRIC RANK
3.5%
SINGLE FATHER HOUSEHOLDS
0.0/ 100
METRIC RATING
340th/ 347
METRIC RANK
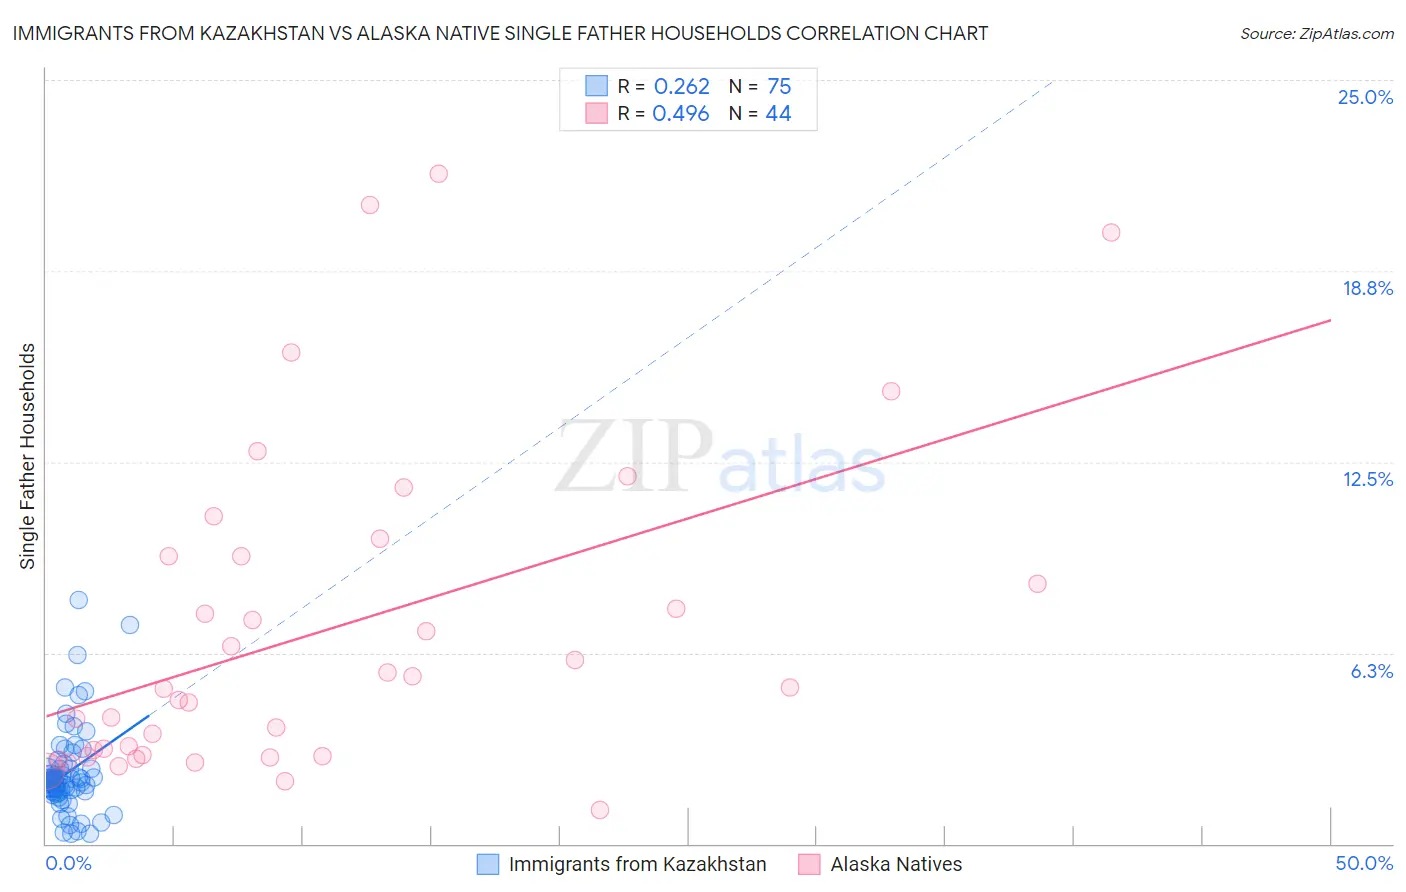
Immigrants from Kazakhstan vs Alaska Native Single Father Households Correlation Chart
The statistical analysis conducted on geographies consisting of 124,033,053 people shows a weak positive correlation between the proportion of Immigrants from Kazakhstan and percentage of single father households in the United States with a correlation coefficient (R) of 0.262 and weighted average of 2.0%. Similarly, the statistical analysis conducted on geographies consisting of 76,608,440 people shows a moderate positive correlation between the proportion of Alaska Natives and percentage of single father households in the United States with a correlation coefficient (R) of 0.496 and weighted average of 3.5%, a difference of 73.8%.
Single Father Households Correlation Summary
| Measurement | Immigrants from Kazakhstan | Alaska Native |
| Minimum | 0.31% | 1.1% |
| Maximum | 8.0% | 21.9% |
| Range | 7.7% | 20.8% |
| Mean | 2.3% | 7.0% |
| Median | 2.1% | 5.1% |
| Interquartile 25% (IQ1) | 1.7% | 2.9% |
| Interquartile 75% (IQ3) | 2.5% | 9.4% |
| Interquartile Range (IQR) | 0.77% | 6.5% |
| Standard Deviation (Sample) | 1.4% | 5.3% |
| Standard Deviation (Population) | 1.4% | 5.2% |
Similar Demographics by Single Father Households
Demographics Similar to Immigrants from Kazakhstan by Single Father Households
In terms of single father households, the demographic groups most similar to Immigrants from Kazakhstan are Immigrants from Serbia (2.0%, a difference of 0.010%), Immigrants from Ukraine (2.0%, a difference of 0.020%), Immigrants from Switzerland (2.0%, a difference of 0.020%), Immigrants from Poland (2.0%, a difference of 0.020%), and Immigrants from Europe (2.0%, a difference of 0.26%).
| Demographics | Rating | Rank | Single Father Households |
| Immigrants | Turkey | 100.0 /100 | #41 | Exceptional 2.0% |
| Macedonians | 100.0 /100 | #42 | Exceptional 2.0% |
| Immigrants | Grenada | 100.0 /100 | #43 | Exceptional 2.0% |
| Latvians | 100.0 /100 | #44 | Exceptional 2.0% |
| Russians | 100.0 /100 | #45 | Exceptional 2.0% |
| Immigrants | Lebanon | 100.0 /100 | #46 | Exceptional 2.0% |
| Immigrants | Ukraine | 99.9 /100 | #47 | Exceptional 2.0% |
| Immigrants | Kazakhstan | 99.9 /100 | #48 | Exceptional 2.0% |
| Immigrants | Serbia | 99.9 /100 | #49 | Exceptional 2.0% |
| Immigrants | Switzerland | 99.9 /100 | #50 | Exceptional 2.0% |
| Immigrants | Poland | 99.9 /100 | #51 | Exceptional 2.0% |
| Immigrants | Europe | 99.9 /100 | #52 | Exceptional 2.0% |
| Immigrants | Northern Europe | 99.9 /100 | #53 | Exceptional 2.0% |
| Immigrants | Korea | 99.9 /100 | #54 | Exceptional 2.0% |
| Immigrants | France | 99.9 /100 | #55 | Exceptional 2.0% |
Demographics Similar to Alaska Natives by Single Father Households
In terms of single father households, the demographic groups most similar to Alaska Natives are Crow (3.5%, a difference of 0.35%), Alaskan Athabascan (3.4%, a difference of 3.8%), Sioux (3.3%, a difference of 5.3%), Pueblo (3.3%, a difference of 6.0%), and Paiute (3.3%, a difference of 6.2%).
| Demographics | Rating | Rank | Single Father Households |
| Natives/Alaskans | 0.0 /100 | #333 | Tragic 3.2% |
| Yuman | 0.0 /100 | #334 | Tragic 3.3% |
| Colville | 0.0 /100 | #335 | Tragic 3.3% |
| Paiute | 0.0 /100 | #336 | Tragic 3.3% |
| Pueblo | 0.0 /100 | #337 | Tragic 3.3% |
| Sioux | 0.0 /100 | #338 | Tragic 3.3% |
| Alaskan Athabascans | 0.0 /100 | #339 | Tragic 3.4% |
| Alaska Natives | 0.0 /100 | #340 | Tragic 3.5% |
| Crow | 0.0 /100 | #341 | Tragic 3.5% |
| Tohono O'odham | 0.0 /100 | #342 | Tragic 3.8% |
| Pima | 0.0 /100 | #343 | Tragic 4.2% |
| Yakama | 0.0 /100 | #344 | Tragic 4.2% |
| Menominee | 0.0 /100 | #345 | Tragic 4.2% |
| Inupiat | 0.0 /100 | #346 | Tragic 4.9% |
| Yup'ik | 0.0 /100 | #347 | Tragic 5.4% |