Immigrants from Israel vs Italian Births to Unmarried Women

COMPARE

Immigrants from Israel
Race
Ancestry
AfghanAfricanAlaska NativeAlaskan AthabascanAlbanianAleutAlsatianAmericanApacheArabArapahoArgentineanArmenianAssyrian/Chaldean/SyriacAustralianAustrianBahamianBangladeshiBarbadianBasqueBelgianBelizeanBermudanBhutaneseBlackfeetBolivianBrazilianBritishBritish West IndianBulgarianBurmeseCajunCambodianCanadianCape VerdeanCarpatho RusynCelticCentral AmericanCentral American IndianCherokeeCheyenneChickasawChileanChineseChippewaChoctawColombianColvilleComancheCosta RicanCreeCreekCroatianCrowCubanCypriotCzechCzechoslovakianDanishDelawareDominicanDutchDutch West IndianEastern EuropeanEcuadorianEgyptianEnglishEstonianEthiopianEuropeanFijianFilipinoFinnishFrenchFrench American IndianFrench CanadianGermanGerman RussianGhanaianGreekGuamanian/ChamorroGuatemalanGuyaneseHaitianHmongHonduranHopiHoumaHungarianIcelanderIndian (Asian)IndonesianInupiatIranianIraqiIrishIroquoisIsraeliJamaicanJapaneseJordanianKenyanKiowaKoreanLaotianLatvianLebaneseLiberianLithuanianLumbeeLuxembourgerMacedonianMalaysianMalteseMarshalleseMenomineeMexicanMexican American IndianMongolianMoroccanNative HawaiianNavajoNepaleseNew ZealanderNicaraguanNigerianNorthern EuropeanNorwegianOkinawanOsageOttawaPaiutePakistaniPalestinianPanamanianParaguayanPennsylvania GermanPeruvianPimaPolishPortuguesePotawatomiPuebloPuerto RicanPuget Sound SalishRomanianRussianSalvadoranSamoanScandinavianScotch-IrishScottishSeminoleSenegaleseSerbianShoshoneSierra LeoneanSiouxSlavicSlovakSloveneSomaliSouth AfricanSouth AmericanSouth American IndianSoviet UnionSpaniardSpanishSpanish AmericanSpanish American IndianSri LankanSubsaharan AfricanSudaneseSwedishSwissSyrianTaiwaneseThaiTlingit-HaidaTohono O'OdhamTonganTrinidadian and TobagonianTsimshianTurkishU.S. Virgin IslanderUgandanUkrainianUruguayanUteVenezuelanVietnameseWelshWest IndianYakamaYaquiYugoslavianYumanYup'ikZimbabwean
Immigration
NonimmigrantsImmigrantsAfghanistanAfricaAlbaniaArgentinaArmeniaAsiaAustraliaAustriaBahamasBangladeshBarbadosBelarusBelgiumBelizeBoliviaBosnia and HerzegovinaBrazilBulgariaBurma/MyanmarCabo VerdeCambodiaCameroonCanadaCaribbeanCentral AmericaChileChinaColombiaCongoCosta RicaCroatiaCubaCzechoslovakiaDenmarkDominicaDominican RepublicEastern AfricaEastern AsiaEastern EuropeEcuadorEgyptEl SalvadorEnglandEritreaEthiopiaEuropeFijiFranceGermanyGhanaGreeceGrenadaGuatemalaGuyanaHaitiHondurasHong KongHungaryIndiaIndonesiaIranIraqIrelandIsraelItalyJamaicaJapanJordanKazakhstanKenyaKoreaKuwaitLaosLatin AmericaLatviaLebanonLiberiaLithuaniaMalaysiaMexicoMicronesiaMiddle AfricaMoldovaMoroccoNepalNetherlandsNicaraguaNigeriaNorth AmericaNorth MacedoniaNorthern AfricaNorthern EuropeNorwayOceaniaPakistanPanamaPeruPhilippinesPolandPortugalRomaniaRussiaSaudi ArabiaScotlandSenegalSerbiaSierra LeoneSingaporeSomaliaSouth AfricaSouth AmericaSouth Central AsiaSouth Eastern AsiaSouthern EuropeSpainSri LankaSt. Vincent and the GrenadinesSudanSwedenSwitzerlandSyriaTaiwanThailandTrinidad and TobagoTurkeyUgandaUkraineUruguayUzbekistanVenezuelaVietnamWest IndiesWestern AfricaWestern AsiaWestern EuropeYemenZaireZimbabweAzores
Italian
Race
Ancestry
AfghanAfricanAlaska NativeAlaskan AthabascanAlbanianAleutAlsatianAmericanApacheArabArapahoArgentineanArmenianAssyrian/Chaldean/SyriacAustralianAustrianBahamianBangladeshiBarbadianBasqueBelgianBelizeanBermudanBhutaneseBlackfeetBolivianBrazilianBritishBritish West IndianBulgarianBurmeseCajunCambodianCanadianCape VerdeanCarpatho RusynCelticCentral AmericanCentral American IndianCherokeeCheyenneChickasawChileanChineseChippewaChoctawColombianColvilleComancheCosta RicanCreeCreekCroatianCrowCubanCypriotCzechCzechoslovakianDanishDelawareDominicanDutchDutch West IndianEastern EuropeanEcuadorianEgyptianEnglishEstonianEthiopianEuropeanFijianFilipinoFinnishFrenchFrench American IndianFrench CanadianGermanGerman RussianGhanaianGreekGuamanian/ChamorroGuatemalanGuyaneseHaitianHmongHonduranHopiHoumaHungarianIcelanderIndian (Asian)IndonesianInupiatIranianIraqiIrishIroquoisIsraeliItalianJamaicanJapaneseJordanianKenyanKiowaKoreanLaotianLatvianLebaneseLiberianLithuanianLumbeeLuxembourgerMacedonianMalaysianMalteseMarshalleseMenomineeMexicanMexican American IndianMongolianMoroccanNative HawaiianNavajoNepaleseNew ZealanderNicaraguanNigerianNorthern EuropeanNorwegianOkinawanOsageOttawaPaiutePakistaniPalestinianPanamanianParaguayanPennsylvania GermanPeruvianPimaPolishPortuguesePotawatomiPuebloPuerto RicanPuget Sound SalishRomanianRussianSalvadoranSamoanScandinavianScotch-IrishScottishSeminoleSenegaleseSerbianShoshoneSierra LeoneanSiouxSlavicSlovakSloveneSomaliSouth AfricanSouth AmericanSouth American IndianSoviet UnionSpaniardSpanishSpanish AmericanSpanish American IndianSri LankanSubsaharan AfricanSudaneseSwedishSwissSyrianTaiwaneseThaiTlingit-HaidaTohono O'OdhamTonganTrinidadian and TobagonianTsimshianTurkishU.S. Virgin IslanderUgandanUkrainianUruguayanUteVenezuelanVietnameseWelshWest IndianYakamaYaquiYugoslavianYumanYup'ikZimbabwean
Immigration
NonimmigrantsImmigrantsAfghanistanAfricaAlbaniaArgentinaArmeniaAsiaAustraliaAustriaBahamasBangladeshBarbadosBelarusBelgiumBelizeBoliviaBosnia and HerzegovinaBrazilBulgariaBurma/MyanmarCabo VerdeCambodiaCameroonCanadaCaribbeanCentral AmericaChileChinaColombiaCongoCosta RicaCroatiaCubaCzechoslovakiaDenmarkDominicaDominican RepublicEastern AfricaEastern AsiaEastern EuropeEcuadorEgyptEl SalvadorEnglandEritreaEthiopiaEuropeFijiFranceGermanyGhanaGreeceGrenadaGuatemalaGuyanaHaitiHondurasHong KongHungaryIndiaIndonesiaIranIraqIrelandItalyJamaicaJapanJordanKazakhstanKenyaKoreaKuwaitLaosLatin AmericaLatviaLebanonLiberiaLithuaniaMalaysiaMexicoMicronesiaMiddle AfricaMoldovaMoroccoNepalNetherlandsNicaraguaNigeriaNorth AmericaNorth MacedoniaNorthern AfricaNorthern EuropeNorwayOceaniaPakistanPanamaPeruPhilippinesPolandPortugalRomaniaRussiaSaudi ArabiaScotlandSenegalSerbiaSierra LeoneSingaporeSomaliaSouth AfricaSouth AmericaSouth Central AsiaSouth Eastern AsiaSouthern EuropeSpainSri LankaSt. Vincent and the GrenadinesSudanSwedenSwitzerlandSyriaTaiwanThailandTrinidad and TobagoTurkeyUgandaUkraineUruguayUzbekistanVenezuelaVietnamWest IndiesWestern AfricaWestern AsiaWestern EuropeYemenZaireZimbabweAzores
Births to Unmarried Women
Income
Poverty
Unemployment
Labor Participation
Family Structure
Vehicle Availability
Education Level
Disability

Births to Unmarried Women Comparison

Immigrants from Israel

Italians

Exceptional
Good
25.1%
BIRTHS TO UNMARRIED WOMEN
100.0/ 100
METRIC RATING
11th/ 347
METRIC RANK
30.8%
BIRTHS TO UNMARRIED WOMEN
77.0/ 100
METRIC RATING
151st/ 347
METRIC RANK

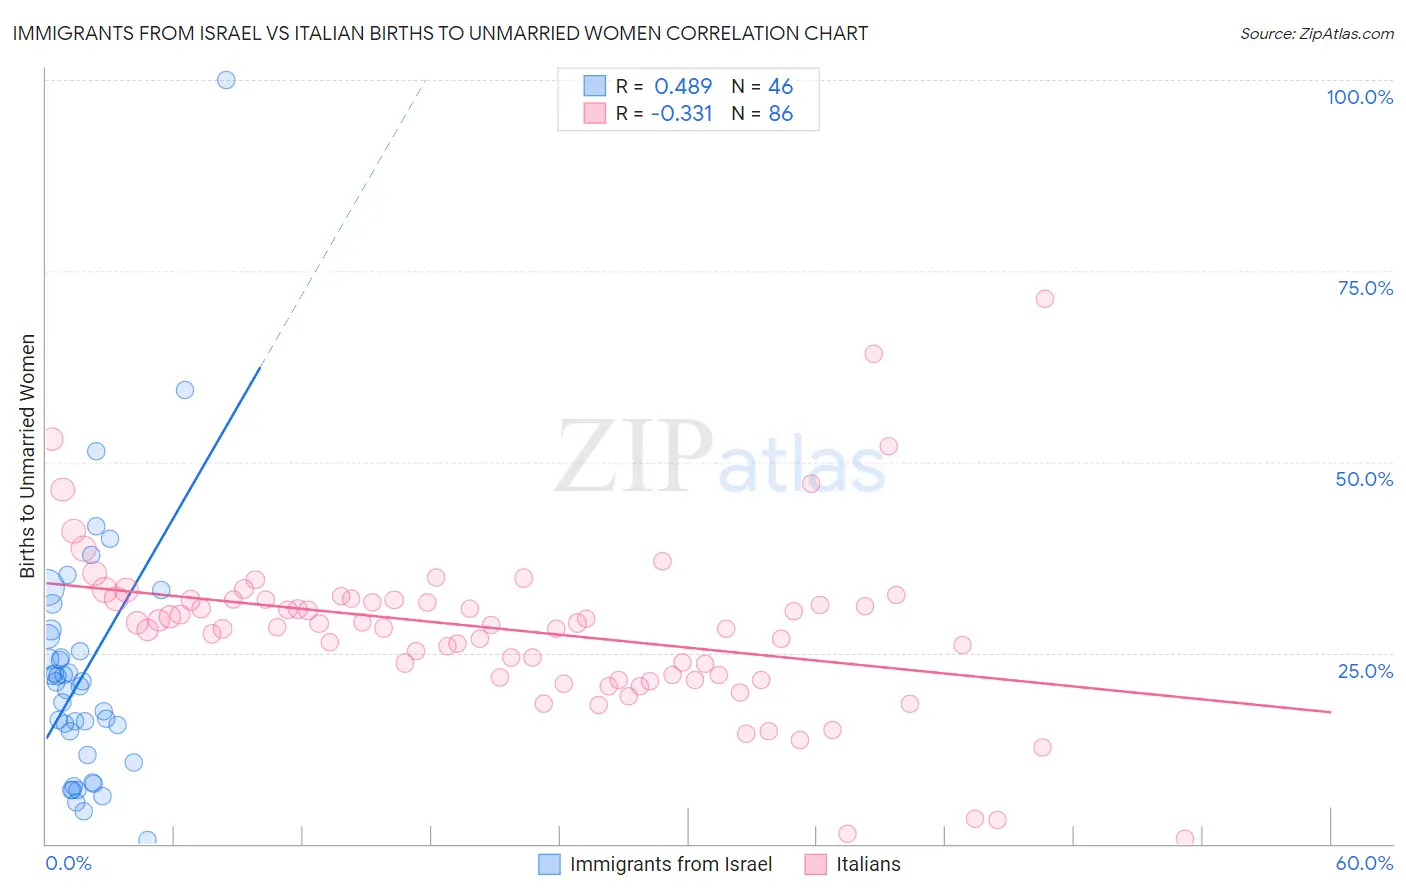
Immigrants from Israel vs Italian Births to Unmarried Women Correlation Chart

The statistical analysis conducted on geographies consisting of 198,005,914 people shows a moderate positive correlation between the proportion of Immigrants from Israel and percentage of births to unmarried women in the United States with a correlation coefficient (R) of 0.489 and weighted average of 25.1%. Similarly, the statistical analysis conducted on geographies consisting of 508,502,070 people shows a mild negative correlation between the proportion of Italians and percentage of births to unmarried women in the United States with a correlation coefficient (R) of -0.331 and weighted average of 30.8%, a difference of 22.4%.
Immigrants from Israel vs Italian Births to Unmarried Women

Births to Unmarried Women Correlation Summary

MeasurementImmigrants from IsraelItalian
Minimum0.50%0.60%
Maximum100.0%71.4%
Range99.5%70.8%
Mean22.6%28.0%
Median20.9%28.5%
Interquartile 25% (IQ1)11.6%21.7%
Interquartile 75% (IQ3)27.2%31.9%
Interquartile Range (IQR)15.6%10.2%
Standard Deviation (Sample)17.0%11.2%
Standard Deviation (Population)16.8%11.1%

Similar Demographics by Births to Unmarried Women

Demographics Similar to Immigrants from Israel by Births to Unmarried Women

In terms of births to unmarried women, the demographic groups most similar to Immigrants from Israel are Immigrants from Eastern Asia (25.0%, a difference of 0.42%), Indian (Asian) (25.3%, a difference of 0.47%), Iranian (25.3%, a difference of 0.61%), Immigrants from Lebanon (25.3%, a difference of 0.73%), and Immigrants from South Central Asia (24.7%, a difference of 1.9%).
DemographicsRating | RankBirths to Unmarried Women
Immigrants | Taiwan
100.0
/100
|
#4
Exceptional
23.0%
Immigrants | Hong Kong
100.0
/100
|
#5
Exceptional
23.6%
Immigrants | Iran
100.0
/100
|
#6
Exceptional
24.0%
Thais
100.0
/100
|
#7
Exceptional
24.0%
Immigrants | China
100.0
/100
|
#8
Exceptional
24.7%
Immigrants | South Central Asia
100.0
/100
|
#9
Exceptional
24.7%
Immigrants | Eastern Asia
100.0
/100
|
#10
Exceptional
25.0%
Immigrants | Israel
100.0
/100
|
#11
Exceptional
25.1%
Indians (Asian)
100.0
/100
|
#12
Exceptional
25.3%
Iranians
100.0
/100
|
#13
Exceptional
25.3%
Immigrants | Lebanon
100.0
/100
|
#14
Exceptional
25.3%
Immigrants | Singapore
100.0
/100
|
#15
Exceptional
25.6%
Immigrants | Belarus
100.0
/100
|
#16
Exceptional
25.6%
Immigrants | Uzbekistan
100.0
/100
|
#17
Exceptional
25.8%
Immigrants | Armenia
99.9
/100
|
#18
Exceptional
26.1%

Demographics Similar to Italians by Births to Unmarried Women

In terms of births to unmarried women, the demographic groups most similar to Italians are Somali (30.7%, a difference of 0.11%), Polish (30.8%, a difference of 0.11%), British (30.8%, a difference of 0.13%), Yugoslavian (30.8%, a difference of 0.25%), and Serbian (30.7%, a difference of 0.26%).
DemographicsRating | RankBirths to Unmarried Women
Czechs
82.1
/100
|
#144
Excellent
30.5%
Immigrants | North America
81.5
/100
|
#145
Excellent
30.6%
Northern Europeans
81.4
/100
|
#146
Excellent
30.6%
Immigrants | Oceania
81.2
/100
|
#147
Excellent
30.6%
Chileans
79.1
/100
|
#148
Good
30.7%
Serbians
78.8
/100
|
#149
Good
30.7%
Somalis
77.8
/100
|
#150
Good
30.7%
Italians
77.0
/100
|
#151
Good
30.8%
Poles
76.2
/100
|
#152
Good
30.8%
British
76.0
/100
|
#153
Good
30.8%
Yugoslavians
75.1
/100
|
#154
Good
30.8%
Immigrants | Bangladesh
73.9
/100
|
#155
Good
30.9%
Carpatho Rusyns
73.5
/100
|
#156
Good
30.9%
Immigrants | Eastern Africa
72.1
/100
|
#157
Good
31.0%
Austrians
69.9
/100
|
#158
Good
31.0%