Immigrants from Ireland vs Norwegian Births to Unmarried Women

COMPARE

Immigrants from Ireland
Race
Ancestry
AfghanAfricanAlaska NativeAlaskan AthabascanAlbanianAleutAlsatianAmericanApacheArabArapahoArgentineanArmenianAssyrian/Chaldean/SyriacAustralianAustrianBahamianBangladeshiBarbadianBasqueBelgianBelizeanBermudanBhutaneseBlackfeetBolivianBrazilianBritishBritish West IndianBulgarianBurmeseCajunCambodianCanadianCape VerdeanCarpatho RusynCelticCentral AmericanCentral American IndianCherokeeCheyenneChickasawChileanChineseChippewaChoctawColombianColvilleComancheCosta RicanCreeCreekCroatianCrowCubanCypriotCzechCzechoslovakianDanishDelawareDominicanDutchDutch West IndianEastern EuropeanEcuadorianEgyptianEnglishEstonianEthiopianEuropeanFijianFilipinoFinnishFrenchFrench American IndianFrench CanadianGermanGerman RussianGhanaianGreekGuamanian/ChamorroGuatemalanGuyaneseHaitianHmongHonduranHopiHoumaHungarianIcelanderIndian (Asian)IndonesianInupiatIranianIraqiIrishIroquoisIsraeliItalianJamaicanJapaneseJordanianKenyanKiowaKoreanLaotianLatvianLebaneseLiberianLithuanianLumbeeLuxembourgerMacedonianMalaysianMalteseMarshalleseMenomineeMexicanMexican American IndianMongolianMoroccanNative HawaiianNavajoNepaleseNew ZealanderNicaraguanNigerianNorthern EuropeanOkinawanOsageOttawaPaiutePakistaniPalestinianPanamanianParaguayanPennsylvania GermanPeruvianPimaPolishPortuguesePotawatomiPuebloPuerto RicanPuget Sound SalishRomanianRussianSalvadoranSamoanScandinavianScotch-IrishScottishSeminoleSenegaleseSerbianShoshoneSierra LeoneanSiouxSlavicSlovakSloveneSomaliSouth AfricanSouth AmericanSouth American IndianSoviet UnionSpaniardSpanishSpanish AmericanSpanish American IndianSri LankanSubsaharan AfricanSudaneseSwedishSwissSyrianTaiwaneseThaiTlingit-HaidaTohono O'OdhamTonganTrinidadian and TobagonianTsimshianTurkishU.S. Virgin IslanderUgandanUkrainianUruguayanUteVenezuelanVietnameseWelshWest IndianYakamaYaquiYugoslavianYumanYup'ikZimbabwean
Immigration
NonimmigrantsImmigrantsAfghanistanAfricaAlbaniaArgentinaArmeniaAsiaAustraliaAustriaBahamasBangladeshBarbadosBelarusBelgiumBelizeBoliviaBosnia and HerzegovinaBrazilBulgariaBurma/MyanmarCabo VerdeCambodiaCameroonCanadaCaribbeanCentral AmericaChileChinaColombiaCongoCosta RicaCroatiaCubaCzechoslovakiaDenmarkDominicaDominican RepublicEastern AfricaEastern AsiaEastern EuropeEcuadorEgyptEl SalvadorEnglandEritreaEthiopiaEuropeFijiFranceGermanyGhanaGreeceGrenadaGuatemalaGuyanaHaitiHondurasHong KongHungaryIndiaIndonesiaIranIraqIrelandIsraelItalyJamaicaJapanJordanKazakhstanKenyaKoreaKuwaitLaosLatin AmericaLatviaLebanonLiberiaLithuaniaMalaysiaMexicoMicronesiaMiddle AfricaMoldovaMoroccoNepalNetherlandsNicaraguaNigeriaNorth AmericaNorth MacedoniaNorthern AfricaNorthern EuropeNorwayOceaniaPakistanPanamaPeruPhilippinesPolandPortugalRomaniaRussiaSaudi ArabiaScotlandSenegalSerbiaSierra LeoneSingaporeSomaliaSouth AfricaSouth AmericaSouth Central AsiaSouth Eastern AsiaSouthern EuropeSpainSri LankaSt. Vincent and the GrenadinesSudanSwedenSwitzerlandSyriaTaiwanThailandTrinidad and TobagoTurkeyUgandaUkraineUruguayUzbekistanVenezuelaVietnamWest IndiesWestern AfricaWestern AsiaWestern EuropeYemenZaireZimbabweAzores
Norwegian
Race
Ancestry
AfghanAfricanAlaska NativeAlaskan AthabascanAlbanianAleutAlsatianAmericanApacheArabArapahoArgentineanArmenianAssyrian/Chaldean/SyriacAustralianAustrianBahamianBangladeshiBarbadianBasqueBelgianBelizeanBermudanBhutaneseBlackfeetBolivianBrazilianBritishBritish West IndianBulgarianBurmeseCajunCambodianCanadianCape VerdeanCarpatho RusynCelticCentral AmericanCentral American IndianCherokeeCheyenneChickasawChileanChineseChippewaChoctawColombianColvilleComancheCosta RicanCreeCreekCroatianCrowCubanCypriotCzechCzechoslovakianDanishDelawareDominicanDutchDutch West IndianEastern EuropeanEcuadorianEgyptianEnglishEstonianEthiopianEuropeanFijianFilipinoFinnishFrenchFrench American IndianFrench CanadianGermanGerman RussianGhanaianGreekGuamanian/ChamorroGuatemalanGuyaneseHaitianHmongHonduranHopiHoumaHungarianIcelanderIndian (Asian)IndonesianInupiatIranianIraqiIrishIroquoisIsraeliItalianJamaicanJapaneseJordanianKenyanKiowaKoreanLaotianLatvianLebaneseLiberianLithuanianLumbeeLuxembourgerMacedonianMalaysianMalteseMarshalleseMenomineeMexicanMexican American IndianMongolianMoroccanNative HawaiianNavajoNepaleseNew ZealanderNicaraguanNigerianNorthern EuropeanNorwegianOkinawanOsageOttawaPaiutePakistaniPalestinianPanamanianParaguayanPennsylvania GermanPeruvianPimaPolishPortuguesePotawatomiPuebloPuerto RicanPuget Sound SalishRomanianRussianSalvadoranSamoanScandinavianScotch-IrishScottishSeminoleSenegaleseSerbianShoshoneSierra LeoneanSiouxSlavicSlovakSloveneSomaliSouth AfricanSouth AmericanSouth American IndianSoviet UnionSpaniardSpanishSpanish AmericanSpanish American IndianSri LankanSubsaharan AfricanSudaneseSwedishSwissSyrianTaiwaneseThaiTlingit-HaidaTohono O'OdhamTonganTrinidadian and TobagonianTsimshianTurkishU.S. Virgin IslanderUgandanUkrainianUruguayanUteVenezuelanVietnameseWelshWest IndianYakamaYaquiYugoslavianYumanYup'ikZimbabwean
Immigration
NonimmigrantsImmigrantsAfghanistanAfricaAlbaniaArgentinaArmeniaAsiaAustraliaAustriaBahamasBangladeshBarbadosBelarusBelgiumBelizeBoliviaBosnia and HerzegovinaBrazilBulgariaBurma/MyanmarCabo VerdeCambodiaCameroonCanadaCaribbeanCentral AmericaChileChinaColombiaCongoCosta RicaCroatiaCubaCzechoslovakiaDenmarkDominicaDominican RepublicEastern AfricaEastern AsiaEastern EuropeEcuadorEgyptEl SalvadorEnglandEritreaEthiopiaEuropeFijiFranceGermanyGhanaGreeceGrenadaGuatemalaGuyanaHaitiHondurasHong KongHungaryIndiaIndonesiaIranIraqIsraelItalyJamaicaJapanJordanKazakhstanKenyaKoreaKuwaitLaosLatin AmericaLatviaLebanonLiberiaLithuaniaMalaysiaMexicoMicronesiaMiddle AfricaMoldovaMoroccoNepalNetherlandsNicaraguaNigeriaNorth AmericaNorth MacedoniaNorthern AfricaNorthern EuropeNorwayOceaniaPakistanPanamaPeruPhilippinesPolandPortugalRomaniaRussiaSaudi ArabiaScotlandSenegalSerbiaSierra LeoneSingaporeSomaliaSouth AfricaSouth AmericaSouth Central AsiaSouth Eastern AsiaSouthern EuropeSpainSri LankaSt. Vincent and the GrenadinesSudanSwedenSwitzerlandSyriaTaiwanThailandTrinidad and TobagoTurkeyUgandaUkraineUruguayUzbekistanVenezuelaVietnamWest IndiesWestern AfricaWestern AsiaWestern EuropeYemenZaireZimbabweAzores
Births to Unmarried Women
Income
Poverty
Unemployment
Labor Participation
Family Structure
Vehicle Availability
Education Level
Disability

Births to Unmarried Women Comparison

Immigrants from Ireland

Norwegians

Exceptional
Exceptional
27.2%
BIRTHS TO UNMARRIED WOMEN
99.7/ 100
METRIC RATING
35th/ 347
METRIC RANK
29.3%
BIRTHS TO UNMARRIED WOMEN
95.8/ 100
METRIC RATING
96th/ 347
METRIC RANK

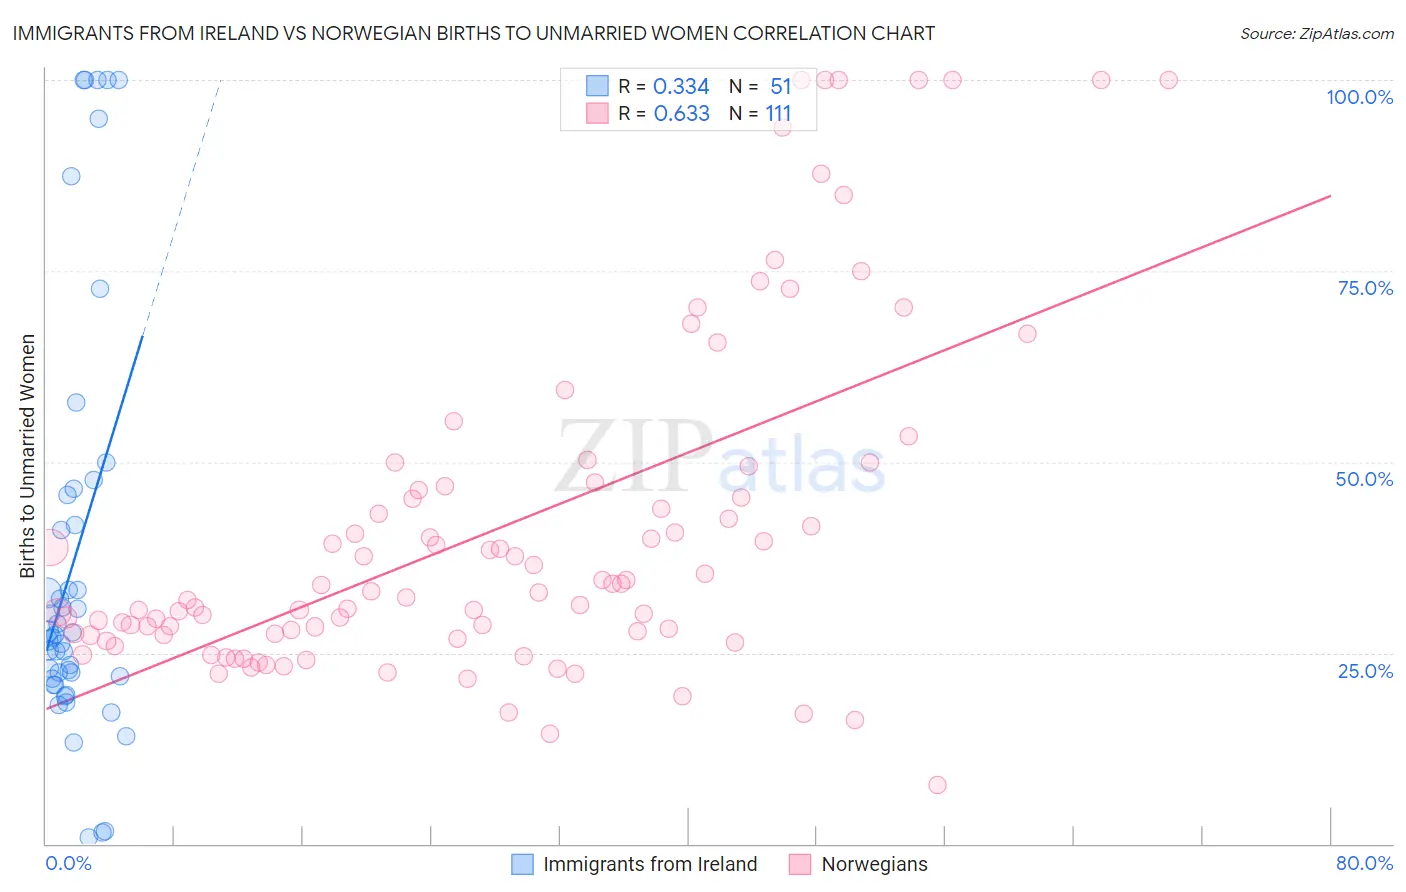
Immigrants from Ireland vs Norwegian Births to Unmarried Women Correlation Chart

The statistical analysis conducted on geographies consisting of 224,472,100 people shows a mild positive correlation between the proportion of Immigrants from Ireland and percentage of births to unmarried women in the United States with a correlation coefficient (R) of 0.334 and weighted average of 27.2%. Similarly, the statistical analysis conducted on geographies consisting of 477,355,885 people shows a significant positive correlation between the proportion of Norwegians and percentage of births to unmarried women in the United States with a correlation coefficient (R) of 0.633 and weighted average of 29.3%, a difference of 7.9%.
Immigrants from Ireland vs Norwegian Births to Unmarried Women

Births to Unmarried Women Correlation Summary

MeasurementImmigrants from IrelandNorwegian
Minimum0.80%7.7%
Maximum100.0%100.0%
Range99.2%92.3%
Mean37.2%41.3%
Median27.3%32.9%
Interquartile 25% (IQ1)21.6%27.3%
Interquartile 75% (IQ3)45.6%46.7%
Interquartile Range (IQR)24.0%19.4%
Standard Deviation (Sample)27.5%22.3%
Standard Deviation (Population)27.2%22.2%

Similar Demographics by Births to Unmarried Women

Demographics Similar to Immigrants from Ireland by Births to Unmarried Women

In terms of births to unmarried women, the demographic groups most similar to Immigrants from Ireland are Immigrants from Pakistan (27.2%, a difference of 0.070%), Immigrants from Western Asia (27.2%, a difference of 0.070%), Immigrants from Sri Lanka (27.2%, a difference of 0.12%), Immigrants from Ukraine (27.2%, a difference of 0.16%), and Immigrants from Russia (27.1%, a difference of 0.19%).
DemographicsRating | RankBirths to Unmarried Women
Okinawans
99.8
/100
|
#28
Exceptional
26.9%
Cypriots
99.8
/100
|
#29
Exceptional
27.0%
Bulgarians
99.8
/100
|
#30
Exceptional
27.1%
Immigrants | Iraq
99.8
/100
|
#31
Exceptional
27.1%
Immigrants | Russia
99.8
/100
|
#32
Exceptional
27.1%
Immigrants | Sri Lanka
99.8
/100
|
#33
Exceptional
27.2%
Immigrants | Pakistan
99.8
/100
|
#34
Exceptional
27.2%
Immigrants | Ireland
99.7
/100
|
#35
Exceptional
27.2%
Immigrants | Western Asia
99.7
/100
|
#36
Exceptional
27.2%
Immigrants | Ukraine
99.7
/100
|
#37
Exceptional
27.2%
Immigrants | Moldova
99.7
/100
|
#38
Exceptional
27.3%
Immigrants | Malaysia
99.7
/100
|
#39
Exceptional
27.4%
Turks
99.6
/100
|
#40
Exceptional
27.4%
Iraqis
99.6
/100
|
#41
Exceptional
27.6%
Immigrants | Eastern Europe
99.6
/100
|
#42
Exceptional
27.6%

Demographics Similar to Norwegians by Births to Unmarried Women

In terms of births to unmarried women, the demographic groups most similar to Norwegians are Immigrants from South Africa (29.3%, a difference of 0.040%), Immigrants from Syria (29.4%, a difference of 0.070%), Immigrants from Vietnam (29.3%, a difference of 0.23%), Immigrants from Denmark (29.4%, a difference of 0.30%), and Luxembourger (29.4%, a difference of 0.30%).
DemographicsRating | RankBirths to Unmarried Women
Immigrants | Saudi Arabia
97.0
/100
|
#89
Exceptional
29.1%
Immigrants | Latvia
96.8
/100
|
#90
Exceptional
29.1%
Immigrants | Fiji
96.6
/100
|
#91
Exceptional
29.2%
Arabs
96.5
/100
|
#92
Exceptional
29.2%
Estonians
96.5
/100
|
#93
Exceptional
29.2%
Ukrainians
96.3
/100
|
#94
Exceptional
29.2%
Immigrants | Vietnam
96.1
/100
|
#95
Exceptional
29.3%
Norwegians
95.8
/100
|
#96
Exceptional
29.3%
Immigrants | South Africa
95.7
/100
|
#97
Exceptional
29.3%
Immigrants | Syria
95.7
/100
|
#98
Exceptional
29.4%
Immigrants | Denmark
95.3
/100
|
#99
Exceptional
29.4%
Luxembourgers
95.2
/100
|
#100
Exceptional
29.4%
Immigrants | Northern Africa
94.7
/100
|
#101
Exceptional
29.5%
Australians
94.6
/100
|
#102
Exceptional
29.5%
Lebanese
94.4
/100
|
#103
Exceptional
29.5%