Immigrants from Iran vs Immigrants from Guatemala Births to Unmarried Women

COMPARE

Immigrants from Iran
Race
Ancestry
AfghanAfricanAlaska NativeAlaskan AthabascanAlbanianAleutAlsatianAmericanApacheArabArapahoArgentineanArmenianAssyrian/Chaldean/SyriacAustralianAustrianBahamianBangladeshiBarbadianBasqueBelgianBelizeanBermudanBhutaneseBlackfeetBolivianBrazilianBritishBritish West IndianBulgarianBurmeseCajunCambodianCanadianCape VerdeanCarpatho RusynCelticCentral AmericanCentral American IndianCherokeeCheyenneChickasawChileanChineseChippewaChoctawColombianColvilleComancheCosta RicanCreeCreekCroatianCrowCubanCypriotCzechCzechoslovakianDanishDelawareDominicanDutchDutch West IndianEastern EuropeanEcuadorianEgyptianEnglishEstonianEthiopianEuropeanFijianFilipinoFinnishFrenchFrench American IndianFrench CanadianGermanGerman RussianGhanaianGreekGuamanian/ChamorroGuatemalanGuyaneseHaitianHmongHonduranHopiHoumaHungarianIcelanderIndian (Asian)IndonesianInupiatIranianIraqiIrishIroquoisIsraeliItalianJamaicanJapaneseJordanianKenyanKiowaKoreanLaotianLatvianLebaneseLiberianLithuanianLumbeeLuxembourgerMacedonianMalaysianMalteseMarshalleseMenomineeMexicanMexican American IndianMongolianMoroccanNative HawaiianNavajoNepaleseNew ZealanderNicaraguanNigerianNorthern EuropeanNorwegianOkinawanOsageOttawaPaiutePakistaniPalestinianPanamanianParaguayanPennsylvania GermanPeruvianPimaPolishPortuguesePotawatomiPuebloPuerto RicanPuget Sound SalishRomanianRussianSalvadoranSamoanScandinavianScotch-IrishScottishSeminoleSenegaleseSerbianShoshoneSierra LeoneanSiouxSlavicSlovakSloveneSomaliSouth AfricanSouth AmericanSouth American IndianSoviet UnionSpaniardSpanishSpanish AmericanSpanish American IndianSri LankanSubsaharan AfricanSudaneseSwedishSwissSyrianTaiwaneseThaiTlingit-HaidaTohono O'OdhamTonganTrinidadian and TobagonianTsimshianTurkishU.S. Virgin IslanderUgandanUkrainianUruguayanUteVenezuelanVietnameseWelshWest IndianYakamaYaquiYugoslavianYumanYup'ikZimbabwean
Immigration
NonimmigrantsImmigrantsAfghanistanAfricaAlbaniaArgentinaArmeniaAsiaAustraliaAustriaBahamasBangladeshBarbadosBelarusBelgiumBelizeBoliviaBosnia and HerzegovinaBrazilBulgariaBurma/MyanmarCabo VerdeCambodiaCameroonCanadaCaribbeanCentral AmericaChileChinaColombiaCongoCosta RicaCroatiaCubaCzechoslovakiaDenmarkDominicaDominican RepublicEastern AfricaEastern AsiaEastern EuropeEcuadorEgyptEl SalvadorEnglandEritreaEthiopiaEuropeFijiFranceGermanyGhanaGreeceGrenadaGuyanaHaitiHondurasHong KongHungaryIndiaIndonesiaIranIraqIrelandIsraelItalyJamaicaJapanJordanKazakhstanKenyaKoreaKuwaitLaosLatin AmericaLatviaLebanonLiberiaLithuaniaMalaysiaMexicoMicronesiaMiddle AfricaMoldovaMoroccoNepalNetherlandsNicaraguaNigeriaNorth AmericaNorth MacedoniaNorthern AfricaNorthern EuropeNorwayOceaniaPakistanPanamaPeruPhilippinesPolandPortugalRomaniaRussiaSaudi ArabiaScotlandSenegalSerbiaSierra LeoneSingaporeSomaliaSouth AfricaSouth AmericaSouth Central AsiaSouth Eastern AsiaSouthern EuropeSpainSri LankaSt. Vincent and the GrenadinesSudanSwedenSwitzerlandSyriaTaiwanThailandTrinidad and TobagoTurkeyUgandaUkraineUruguayUzbekistanVenezuelaVietnamWest IndiesWestern AfricaWestern AsiaWestern EuropeYemenZaireZimbabweAzores
Immigrants from Guatemala
Race
Ancestry
AfghanAfricanAlaska NativeAlaskan AthabascanAlbanianAleutAlsatianAmericanApacheArabArapahoArgentineanArmenianAssyrian/Chaldean/SyriacAustralianAustrianBahamianBangladeshiBarbadianBasqueBelgianBelizeanBermudanBhutaneseBlackfeetBolivianBrazilianBritishBritish West IndianBulgarianBurmeseCajunCambodianCanadianCape VerdeanCarpatho RusynCelticCentral AmericanCentral American IndianCherokeeCheyenneChickasawChileanChineseChippewaChoctawColombianColvilleComancheCosta RicanCreeCreekCroatianCrowCubanCypriotCzechCzechoslovakianDanishDelawareDominicanDutchDutch West IndianEastern EuropeanEcuadorianEgyptianEnglishEstonianEthiopianEuropeanFijianFilipinoFinnishFrenchFrench American IndianFrench CanadianGermanGerman RussianGhanaianGreekGuamanian/ChamorroGuatemalanGuyaneseHaitianHmongHonduranHopiHoumaHungarianIcelanderIndian (Asian)IndonesianInupiatIranianIraqiIrishIroquoisIsraeliItalianJamaicanJapaneseJordanianKenyanKiowaKoreanLaotianLatvianLebaneseLiberianLithuanianLumbeeLuxembourgerMacedonianMalaysianMalteseMarshalleseMenomineeMexicanMexican American IndianMongolianMoroccanNative HawaiianNavajoNepaleseNew ZealanderNicaraguanNigerianNorthern EuropeanNorwegianOkinawanOsageOttawaPaiutePakistaniPalestinianPanamanianParaguayanPennsylvania GermanPeruvianPimaPolishPortuguesePotawatomiPuebloPuerto RicanPuget Sound SalishRomanianRussianSalvadoranSamoanScandinavianScotch-IrishScottishSeminoleSenegaleseSerbianShoshoneSierra LeoneanSiouxSlavicSlovakSloveneSomaliSouth AfricanSouth AmericanSouth American IndianSoviet UnionSpaniardSpanishSpanish AmericanSpanish American IndianSri LankanSubsaharan AfricanSudaneseSwedishSwissSyrianTaiwaneseThaiTlingit-HaidaTohono O'OdhamTonganTrinidadian and TobagonianTsimshianTurkishU.S. Virgin IslanderUgandanUkrainianUruguayanUteVenezuelanVietnameseWelshWest IndianYakamaYaquiYugoslavianYumanYup'ikZimbabwean
Immigration
NonimmigrantsImmigrantsAfghanistanAfricaAlbaniaArgentinaArmeniaAsiaAustraliaAustriaBahamasBangladeshBarbadosBelarusBelgiumBelizeBoliviaBosnia and HerzegovinaBrazilBulgariaBurma/MyanmarCabo VerdeCambodiaCameroonCanadaCaribbeanCentral AmericaChileChinaColombiaCongoCosta RicaCroatiaCubaCzechoslovakiaDenmarkDominicaDominican RepublicEastern AfricaEastern AsiaEastern EuropeEcuadorEgyptEl SalvadorEnglandEritreaEthiopiaEuropeFijiFranceGermanyGhanaGreeceGrenadaGuatemalaGuyanaHaitiHondurasHong KongHungaryIndiaIndonesiaIraqIrelandIsraelItalyJamaicaJapanJordanKazakhstanKenyaKoreaKuwaitLaosLatin AmericaLatviaLebanonLiberiaLithuaniaMalaysiaMexicoMicronesiaMiddle AfricaMoldovaMoroccoNepalNetherlandsNicaraguaNigeriaNorth AmericaNorth MacedoniaNorthern AfricaNorthern EuropeNorwayOceaniaPakistanPanamaPeruPhilippinesPolandPortugalRomaniaRussiaSaudi ArabiaScotlandSenegalSerbiaSierra LeoneSingaporeSomaliaSouth AfricaSouth AmericaSouth Central AsiaSouth Eastern AsiaSouthern EuropeSpainSri LankaSt. Vincent and the GrenadinesSudanSwedenSwitzerlandSyriaTaiwanThailandTrinidad and TobagoTurkeyUgandaUkraineUruguayUzbekistanVenezuelaVietnamWest IndiesWestern AfricaWestern AsiaWestern EuropeYemenZaireZimbabweAzores
Births to Unmarried Women
Income
Poverty
Unemployment
Labor Participation
Family Structure
Vehicle Availability
Education Level
Disability

Births to Unmarried Women Comparison

Immigrants from Iran

Immigrants from Guatemala

Exceptional
Tragic
24.0%
BIRTHS TO UNMARRIED WOMEN
100.0/ 100
METRIC RATING
6th/ 347
METRIC RANK
37.5%
BIRTHS TO UNMARRIED WOMEN
0.0/ 100
METRIC RATING
286th/ 347
METRIC RANK

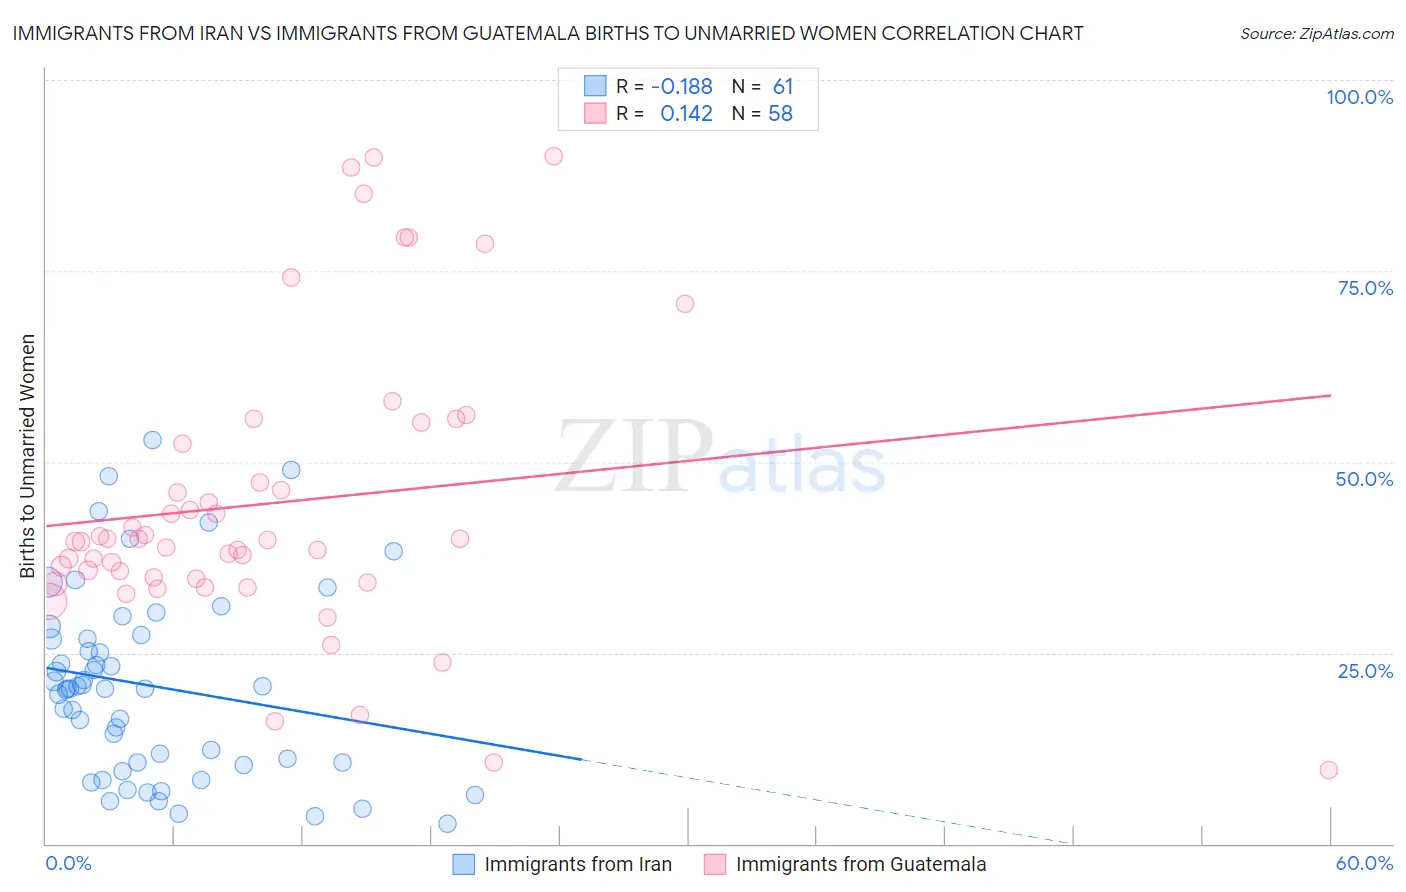
Immigrants from Iran vs Immigrants from Guatemala Births to Unmarried Women Correlation Chart

The statistical analysis conducted on geographies consisting of 263,743,481 people shows a poor negative correlation between the proportion of Immigrants from Iran and percentage of births to unmarried women in the United States with a correlation coefficient (R) of -0.188 and weighted average of 24.0%. Similarly, the statistical analysis conducted on geographies consisting of 358,367,687 people shows a poor positive correlation between the proportion of Immigrants from Guatemala and percentage of births to unmarried women in the United States with a correlation coefficient (R) of 0.142 and weighted average of 37.5%, a difference of 56.5%.
Immigrants from Iran vs Immigrants from Guatemala Births to Unmarried Women

Births to Unmarried Women Correlation Summary

MeasurementImmigrants from IranImmigrants from Guatemala
Minimum2.7%9.7%
Maximum52.8%90.0%
Range50.1%80.3%
Mean20.6%44.6%
Median20.3%39.6%
Interquartile 25% (IQ1)10.4%34.7%
Interquartile 75% (IQ3)27.1%52.4%
Interquartile Range (IQR)16.6%17.8%
Standard Deviation (Sample)12.2%18.9%
Standard Deviation (Population)12.1%18.7%

Similar Demographics by Births to Unmarried Women

Demographics Similar to Immigrants from Iran by Births to Unmarried Women

In terms of births to unmarried women, the demographic groups most similar to Immigrants from Iran are Thai (24.0%, a difference of 0.29%), Immigrants from Hong Kong (23.6%, a difference of 1.6%), Immigrants from China (24.7%, a difference of 3.0%), Immigrants from South Central Asia (24.7%, a difference of 3.0%), and Immigrants from Taiwan (23.0%, a difference of 4.1%).
DemographicsRating | RankBirths to Unmarried Women
Assyrians/Chaldeans/Syriacs
100.0
/100
|
#1
Exceptional
22.0%
Immigrants | India
100.0
/100
|
#2
Exceptional
22.9%
Filipinos
100.0
/100
|
#3
Exceptional
23.0%
Immigrants | Taiwan
100.0
/100
|
#4
Exceptional
23.0%
Immigrants | Hong Kong
100.0
/100
|
#5
Exceptional
23.6%
Immigrants | Iran
100.0
/100
|
#6
Exceptional
24.0%
Thais
100.0
/100
|
#7
Exceptional
24.0%
Immigrants | China
100.0
/100
|
#8
Exceptional
24.7%
Immigrants | South Central Asia
100.0
/100
|
#9
Exceptional
24.7%
Immigrants | Eastern Asia
100.0
/100
|
#10
Exceptional
25.0%
Immigrants | Israel
100.0
/100
|
#11
Exceptional
25.1%
Indians (Asian)
100.0
/100
|
#12
Exceptional
25.3%
Iranians
100.0
/100
|
#13
Exceptional
25.3%
Immigrants | Lebanon
100.0
/100
|
#14
Exceptional
25.3%
Immigrants | Singapore
100.0
/100
|
#15
Exceptional
25.6%

Demographics Similar to Immigrants from Guatemala by Births to Unmarried Women

In terms of births to unmarried women, the demographic groups most similar to Immigrants from Guatemala are Immigrants from Mexico (37.5%, a difference of 0.010%), Immigrants from Central America (37.4%, a difference of 0.11%), Spanish American Indian (37.4%, a difference of 0.18%), Creek (37.6%, a difference of 0.23%), and Liberian (37.4%, a difference of 0.26%).
DemographicsRating | RankBirths to Unmarried Women
West Indians
0.1
/100
|
#279
Tragic
37.3%
Immigrants | St. Vincent and the Grenadines
0.1
/100
|
#280
Tragic
37.3%
Immigrants | Belize
0.1
/100
|
#281
Tragic
37.3%
Liberians
0.0
/100
|
#282
Tragic
37.4%
Spanish American Indians
0.0
/100
|
#283
Tragic
37.4%
Immigrants | Central America
0.0
/100
|
#284
Tragic
37.4%
Immigrants | Mexico
0.0
/100
|
#285
Tragic
37.5%
Immigrants | Guatemala
0.0
/100
|
#286
Tragic
37.5%
Creek
0.0
/100
|
#287
Tragic
37.6%
Immigrants | Liberia
0.0
/100
|
#288
Tragic
37.6%
Alaskan Athabascans
0.0
/100
|
#289
Tragic
37.7%
Hispanics or Latinos
0.0
/100
|
#290
Tragic
37.8%
Seminole
0.0
/100
|
#291
Tragic
37.9%
Blackfeet
0.0
/100
|
#292
Tragic
37.9%
Immigrants | Nicaragua
0.0
/100
|
#293
Tragic
38.0%