Immigrants from Indonesia vs South American Average Family Size
COMPARE
Immigrants from Indonesia
South American
Average Family Size
Average Family Size Comparison
Immigrants from Indonesia
South Americans
3.27
AVERAGE FAMILY SIZE
93.7/ 100
METRIC RATING
119th/ 347
METRIC RANK
3.27
AVERAGE FAMILY SIZE
95.1/ 100
METRIC RATING
114th/ 347
METRIC RANK
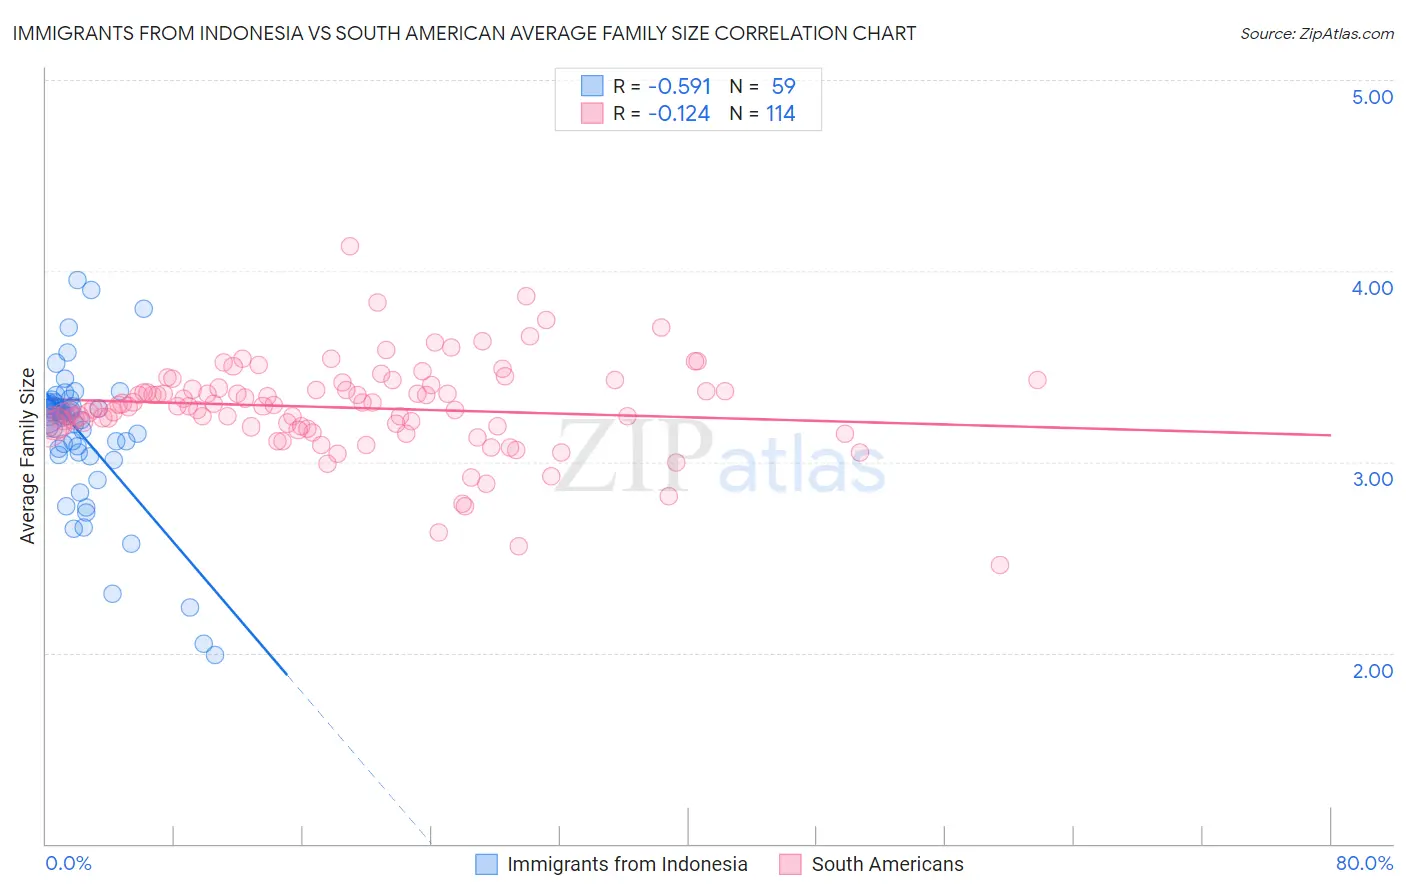
Immigrants from Indonesia vs South American Average Family Size Correlation Chart
The statistical analysis conducted on geographies consisting of 215,720,751 people shows a substantial negative correlation between the proportion of Immigrants from Indonesia and average family size in the United States with a correlation coefficient (R) of -0.591 and weighted average of 3.27. Similarly, the statistical analysis conducted on geographies consisting of 493,671,648 people shows a poor negative correlation between the proportion of South Americans and average family size in the United States with a correlation coefficient (R) of -0.124 and weighted average of 3.27, a difference of 0.12%.
Average Family Size Correlation Summary
| Measurement | Immigrants from Indonesia | South American |
| Minimum | 1.99 | 2.46 |
| Maximum | 3.95 | 4.13 |
| Range | 1.96 | 1.67 |
| Mean | 3.14 | 3.28 |
| Median | 3.24 | 3.29 |
| Interquartile 25% (IQ1) | 3.04 | 3.18 |
| Interquartile 75% (IQ3) | 3.31 | 3.39 |
| Interquartile Range (IQR) | 0.27 | 0.20 |
| Standard Deviation (Sample) | 0.38 | 0.24 |
| Standard Deviation (Population) | 0.38 | 0.24 |
Demographics Similar to Immigrants from Indonesia and South Americans by Average Family Size
In terms of average family size, the demographic groups most similar to Immigrants from Indonesia are Immigrants from Bahamas (3.27, a difference of 0.010%), Immigrants from Asia (3.27, a difference of 0.020%), Immigrants from Thailand (3.27, a difference of 0.040%), Immigrants from Colombia (3.27, a difference of 0.070%), and Kiowa (3.27, a difference of 0.090%). Similarly, the demographic groups most similar to South Americans are Immigrants from Liberia (3.27, a difference of 0.010%), Immigrants from South America (3.27, a difference of 0.010%), Kiowa (3.27, a difference of 0.030%), Immigrants from Panama (3.27, a difference of 0.050%), and Black/African American (3.27, a difference of 0.060%).
| Demographics | Rating | Rank | Average Family Size |
| Paiute | 98.0 /100 | #106 | Exceptional 3.29 |
| Ghanaians | 98.0 /100 | #107 | Exceptional 3.29 |
| Asians | 97.0 /100 | #108 | Exceptional 3.28 |
| Puerto Ricans | 96.7 /100 | #109 | Exceptional 3.28 |
| Bahamians | 96.6 /100 | #110 | Exceptional 3.28 |
| Indonesians | 96.2 /100 | #111 | Exceptional 3.28 |
| Blacks/African Americans | 95.7 /100 | #112 | Exceptional 3.27 |
| Immigrants | Panama | 95.6 /100 | #113 | Exceptional 3.27 |
| South Americans | 95.1 /100 | #114 | Exceptional 3.27 |
| Immigrants | Liberia | 95.0 /100 | #115 | Exceptional 3.27 |
| Immigrants | South America | 95.0 /100 | #116 | Exceptional 3.27 |
| Kiowa | 94.8 /100 | #117 | Exceptional 3.27 |
| Immigrants | Asia | 94.0 /100 | #118 | Exceptional 3.27 |
| Immigrants | Indonesia | 93.7 /100 | #119 | Exceptional 3.27 |
| Immigrants | Bahamas | 93.6 /100 | #120 | Exceptional 3.27 |
| Immigrants | Thailand | 93.3 /100 | #121 | Exceptional 3.27 |
| Immigrants | Colombia | 92.8 /100 | #122 | Exceptional 3.27 |
| Alaskan Athabascans | 92.4 /100 | #123 | Exceptional 3.27 |
| South American Indians | 91.6 /100 | #124 | Exceptional 3.26 |
| Immigrants | Cuba | 91.3 /100 | #125 | Exceptional 3.26 |
| Immigrants | Costa Rica | 90.7 /100 | #126 | Exceptional 3.26 |