Immigrants from India vs German Russian Currently Married
COMPARE
Immigrants from India
German Russian
Currently Married
Currently Married Comparison
Immigrants from India
German Russians
51.8%
CURRENTLY MARRIED
100.0/ 100
METRIC RATING
1st/ 347
METRIC RANK
45.5%
CURRENTLY MARRIED
6.7/ 100
METRIC RATING
215th/ 347
METRIC RANK
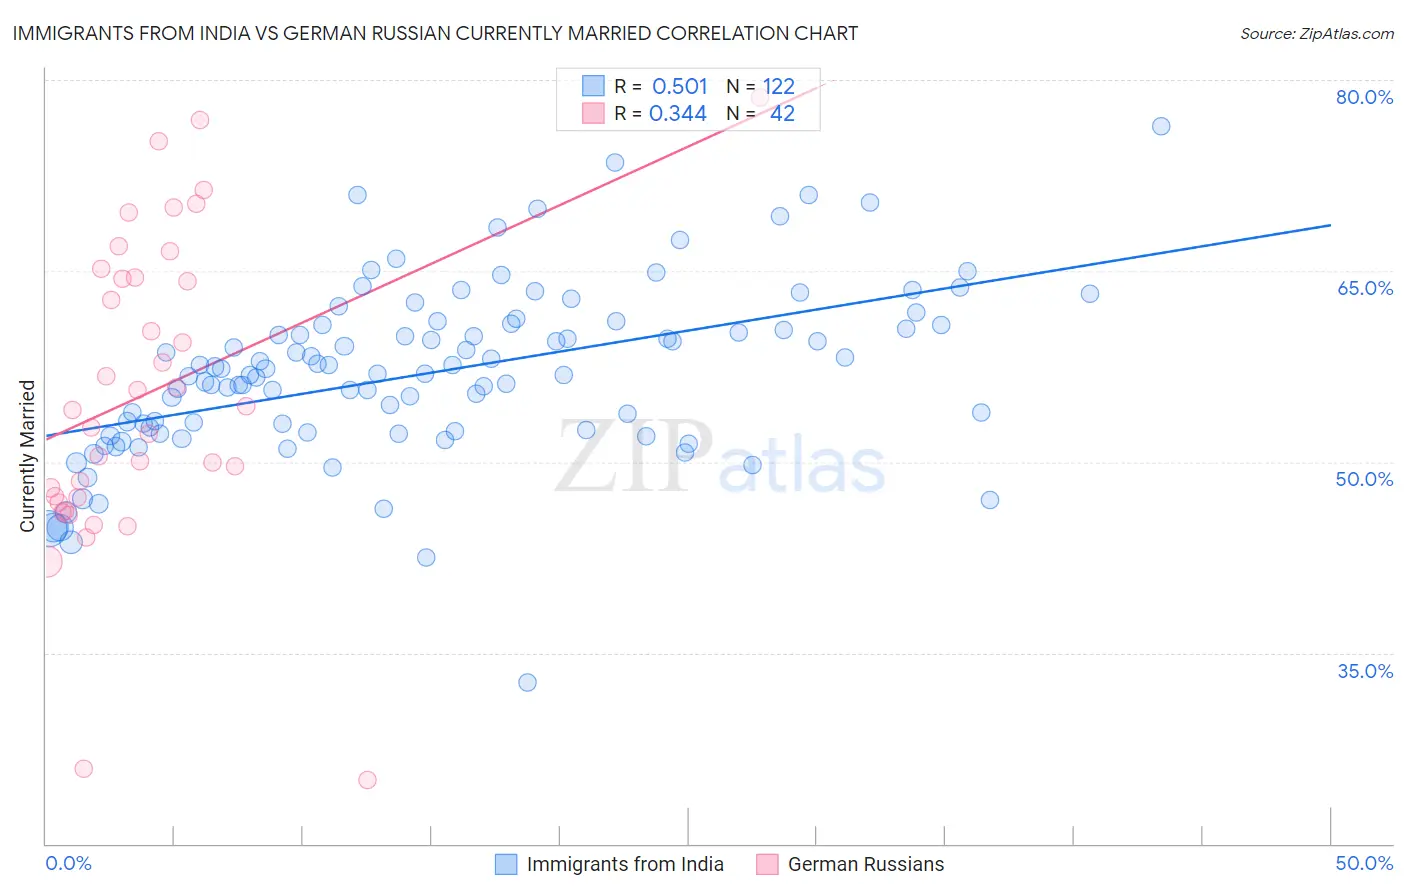
Immigrants from India vs German Russian Currently Married Correlation Chart
The statistical analysis conducted on geographies consisting of 434,052,762 people shows a substantial positive correlation between the proportion of Immigrants from India and percentage of population currently married in the United States with a correlation coefficient (R) of 0.501 and weighted average of 51.8%. Similarly, the statistical analysis conducted on geographies consisting of 96,455,839 people shows a mild positive correlation between the proportion of German Russians and percentage of population currently married in the United States with a correlation coefficient (R) of 0.344 and weighted average of 45.5%, a difference of 13.7%.
Currently Married Correlation Summary
| Measurement | Immigrants from India | German Russian |
| Minimum | 32.7% | 25.0% |
| Maximum | 76.4% | 78.6% |
| Range | 43.7% | 53.6% |
| Mean | 57.0% | 55.4% |
| Median | 56.9% | 54.2% |
| Interquartile 25% (IQ1) | 52.4% | 47.2% |
| Interquartile 75% (IQ3) | 60.7% | 64.5% |
| Interquartile Range (IQR) | 8.3% | 17.3% |
| Standard Deviation (Sample) | 6.8% | 12.1% |
| Standard Deviation (Population) | 6.8% | 12.0% |
Similar Demographics by Currently Married
Demographics Similar to Immigrants from India by Currently Married
In terms of currently married, the demographic groups most similar to Immigrants from India are Thai (50.9%, a difference of 1.8%), Assyrian/Chaldean/Syriac (50.8%, a difference of 1.9%), Immigrants from Taiwan (50.7%, a difference of 2.0%), Danish (50.5%, a difference of 2.6%), and Norwegian (50.2%, a difference of 3.1%).
| Demographics | Rating | Rank | Currently Married |
| Immigrants | India | 100.0 /100 | #1 | Exceptional 51.8% |
| Thais | 100.0 /100 | #2 | Exceptional 50.9% |
| Assyrians/Chaldeans/Syriacs | 100.0 /100 | #3 | Exceptional 50.8% |
| Immigrants | Taiwan | 100.0 /100 | #4 | Exceptional 50.7% |
| Danes | 100.0 /100 | #5 | Exceptional 50.5% |
| Norwegians | 100.0 /100 | #6 | Exceptional 50.2% |
| Immigrants | South Central Asia | 100.0 /100 | #7 | Exceptional 50.0% |
| Swedes | 100.0 /100 | #8 | Exceptional 50.0% |
| Czechs | 99.9 /100 | #9 | Exceptional 49.9% |
| Filipinos | 99.9 /100 | #10 | Exceptional 49.7% |
| English | 99.9 /100 | #11 | Exceptional 49.7% |
| Swiss | 99.9 /100 | #12 | Exceptional 49.7% |
| Dutch | 99.9 /100 | #13 | Exceptional 49.6% |
| Germans | 99.9 /100 | #14 | Exceptional 49.6% |
| Pennsylvania Germans | 99.9 /100 | #15 | Exceptional 49.6% |
Demographics Similar to German Russians by Currently Married
In terms of currently married, the demographic groups most similar to German Russians are Dutch West Indian (45.5%, a difference of 0.0%), Alaska Native (45.5%, a difference of 0.040%), Marshallese (45.5%, a difference of 0.070%), Houma (45.5%, a difference of 0.080%), and Uruguayan (45.6%, a difference of 0.16%).
| Demographics | Rating | Rank | Currently Married |
| Alsatians | 10.8 /100 | #208 | Poor 45.7% |
| Immigrants | Micronesia | 8.8 /100 | #209 | Tragic 45.6% |
| Uruguayans | 7.9 /100 | #210 | Tragic 45.6% |
| Houma | 7.2 /100 | #211 | Tragic 45.5% |
| Marshallese | 7.2 /100 | #212 | Tragic 45.5% |
| Alaska Natives | 7.0 /100 | #213 | Tragic 45.5% |
| Dutch West Indians | 6.7 /100 | #214 | Tragic 45.5% |
| German Russians | 6.7 /100 | #215 | Tragic 45.5% |
| Immigrants | Morocco | 5.5 /100 | #216 | Tragic 45.4% |
| Immigrants | Thailand | 5.1 /100 | #217 | Tragic 45.4% |
| Panamanians | 4.0 /100 | #218 | Tragic 45.3% |
| Immigrants | Portugal | 3.5 /100 | #219 | Tragic 45.2% |
| Kenyans | 3.1 /100 | #220 | Tragic 45.2% |
| Mexicans | 3.0 /100 | #221 | Tragic 45.2% |
| Immigrants | Azores | 2.5 /100 | #222 | Tragic 45.1% |