Immigrants from Hong Kong vs Seminole Single Mother Households

COMPARE

Immigrants from Hong Kong
Race
Ancestry
AfghanAfricanAlaska NativeAlaskan AthabascanAlbanianAleutAlsatianAmericanApacheArabArapahoArgentineanArmenianAssyrian/Chaldean/SyriacAustralianAustrianBahamianBangladeshiBarbadianBasqueBelgianBelizeanBermudanBhutaneseBlackfeetBolivianBrazilianBritishBritish West IndianBulgarianBurmeseCajunCambodianCanadianCape VerdeanCarpatho RusynCelticCentral AmericanCentral American IndianCherokeeCheyenneChickasawChileanChineseChippewaChoctawColombianColvilleComancheCosta RicanCreeCreekCroatianCrowCubanCypriotCzechCzechoslovakianDanishDelawareDominicanDutchDutch West IndianEastern EuropeanEcuadorianEgyptianEnglishEstonianEthiopianEuropeanFijianFilipinoFinnishFrenchFrench American IndianFrench CanadianGermanGerman RussianGhanaianGreekGuamanian/ChamorroGuatemalanGuyaneseHaitianHmongHonduranHopiHoumaHungarianIcelanderIndian (Asian)IndonesianInupiatIranianIraqiIrishIroquoisIsraeliItalianJamaicanJapaneseJordanianKenyanKiowaKoreanLaotianLatvianLebaneseLiberianLithuanianLumbeeLuxembourgerMacedonianMalaysianMalteseMarshalleseMenomineeMexicanMexican American IndianMongolianMoroccanNative HawaiianNavajoNepaleseNew ZealanderNicaraguanNigerianNorthern EuropeanNorwegianOkinawanOsageOttawaPaiutePakistaniPalestinianPanamanianParaguayanPennsylvania GermanPeruvianPimaPolishPortuguesePotawatomiPuebloPuerto RicanPuget Sound SalishRomanianRussianSalvadoranSamoanScandinavianScotch-IrishScottishSenegaleseSerbianShoshoneSierra LeoneanSiouxSlavicSlovakSloveneSomaliSouth AfricanSouth AmericanSouth American IndianSoviet UnionSpaniardSpanishSpanish AmericanSpanish American IndianSri LankanSubsaharan AfricanSudaneseSwedishSwissSyrianTaiwaneseThaiTlingit-HaidaTohono O'OdhamTonganTrinidadian and TobagonianTsimshianTurkishU.S. Virgin IslanderUgandanUkrainianUruguayanUteVenezuelanVietnameseWelshWest IndianYakamaYaquiYugoslavianYumanYup'ikZimbabwean
Immigration
NonimmigrantsImmigrantsAfghanistanAfricaAlbaniaArgentinaArmeniaAsiaAustraliaAustriaBahamasBangladeshBarbadosBelarusBelgiumBelizeBoliviaBosnia and HerzegovinaBrazilBulgariaBurma/MyanmarCabo VerdeCambodiaCameroonCanadaCaribbeanCentral AmericaChileChinaColombiaCongoCosta RicaCroatiaCubaCzechoslovakiaDenmarkDominicaDominican RepublicEastern AfricaEastern AsiaEastern EuropeEcuadorEgyptEl SalvadorEnglandEritreaEthiopiaEuropeFijiFranceGermanyGhanaGreeceGrenadaGuatemalaGuyanaHaitiHondurasHong KongHungaryIndiaIndonesiaIranIraqIrelandIsraelItalyJamaicaJapanJordanKazakhstanKenyaKoreaKuwaitLaosLatin AmericaLatviaLebanonLiberiaLithuaniaMalaysiaMexicoMicronesiaMiddle AfricaMoldovaMoroccoNepalNetherlandsNicaraguaNigeriaNorth AmericaNorth MacedoniaNorthern AfricaNorthern EuropeNorwayOceaniaPakistanPanamaPeruPhilippinesPolandPortugalRomaniaRussiaSaudi ArabiaScotlandSenegalSerbiaSierra LeoneSingaporeSomaliaSouth AfricaSouth AmericaSouth Central AsiaSouth Eastern AsiaSouthern EuropeSpainSri LankaSt. Vincent and the GrenadinesSudanSwedenSwitzerlandSyriaTaiwanThailandTrinidad and TobagoTurkeyUgandaUkraineUruguayUzbekistanVenezuelaVietnamWest IndiesWestern AfricaWestern AsiaWestern EuropeYemenZaireZimbabweAzores
Seminole
Race
Ancestry
AfghanAfricanAlaska NativeAlaskan AthabascanAlbanianAleutAlsatianAmericanApacheArabArapahoArgentineanArmenianAssyrian/Chaldean/SyriacAustralianAustrianBahamianBangladeshiBarbadianBasqueBelgianBelizeanBermudanBhutaneseBlackfeetBolivianBrazilianBritishBritish West IndianBulgarianBurmeseCajunCambodianCanadianCape VerdeanCarpatho RusynCelticCentral AmericanCentral American IndianCherokeeCheyenneChickasawChileanChineseChippewaChoctawColombianColvilleComancheCosta RicanCreeCreekCroatianCrowCubanCypriotCzechCzechoslovakianDanishDelawareDominicanDutchDutch West IndianEastern EuropeanEcuadorianEgyptianEnglishEstonianEthiopianEuropeanFijianFilipinoFinnishFrenchFrench American IndianFrench CanadianGermanGerman RussianGhanaianGreekGuamanian/ChamorroGuatemalanGuyaneseHaitianHmongHonduranHopiHoumaHungarianIcelanderIndian (Asian)IndonesianInupiatIranianIraqiIrishIroquoisIsraeliItalianJamaicanJapaneseJordanianKenyanKiowaKoreanLaotianLatvianLebaneseLiberianLithuanianLumbeeLuxembourgerMacedonianMalaysianMalteseMarshalleseMenomineeMexicanMexican American IndianMongolianMoroccanNative HawaiianNavajoNepaleseNew ZealanderNicaraguanNigerianNorthern EuropeanNorwegianOkinawanOsageOttawaPaiutePakistaniPalestinianPanamanianParaguayanPennsylvania GermanPeruvianPimaPolishPortuguesePotawatomiPuebloPuerto RicanPuget Sound SalishRomanianRussianSalvadoranSamoanScandinavianScotch-IrishScottishSeminoleSenegaleseSerbianShoshoneSierra LeoneanSiouxSlavicSlovakSloveneSomaliSouth AfricanSouth AmericanSouth American IndianSoviet UnionSpaniardSpanishSpanish AmericanSpanish American IndianSri LankanSubsaharan AfricanSudaneseSwedishSwissSyrianTaiwaneseThaiTlingit-HaidaTohono O'OdhamTonganTrinidadian and TobagonianTsimshianTurkishU.S. Virgin IslanderUgandanUkrainianUruguayanUteVenezuelanVietnameseWelshWest IndianYakamaYaquiYugoslavianYumanYup'ikZimbabwean
Immigration
NonimmigrantsImmigrantsAfghanistanAfricaAlbaniaArgentinaArmeniaAsiaAustraliaAustriaBahamasBangladeshBarbadosBelarusBelgiumBelizeBoliviaBosnia and HerzegovinaBrazilBulgariaBurma/MyanmarCabo VerdeCambodiaCameroonCanadaCaribbeanCentral AmericaChileChinaColombiaCongoCosta RicaCroatiaCubaCzechoslovakiaDenmarkDominicaDominican RepublicEastern AfricaEastern AsiaEastern EuropeEcuadorEgyptEl SalvadorEnglandEritreaEthiopiaEuropeFijiFranceGermanyGhanaGreeceGrenadaGuatemalaGuyanaHaitiHondurasHungaryIndiaIndonesiaIranIraqIrelandIsraelItalyJamaicaJapanJordanKazakhstanKenyaKoreaKuwaitLaosLatin AmericaLatviaLebanonLiberiaLithuaniaMalaysiaMexicoMicronesiaMiddle AfricaMoldovaMoroccoNepalNetherlandsNicaraguaNigeriaNorth AmericaNorth MacedoniaNorthern AfricaNorthern EuropeNorwayOceaniaPakistanPanamaPeruPhilippinesPolandPortugalRomaniaRussiaSaudi ArabiaScotlandSenegalSerbiaSierra LeoneSingaporeSomaliaSouth AfricaSouth AmericaSouth Central AsiaSouth Eastern AsiaSouthern EuropeSpainSri LankaSt. Vincent and the GrenadinesSudanSwedenSwitzerlandSyriaTaiwanThailandTrinidad and TobagoTurkeyUgandaUkraineUruguayUzbekistanVenezuelaVietnamWest IndiesWestern AfricaWestern AsiaWestern EuropeYemenZaireZimbabweAzores
Single Mother Households
Income
Poverty
Unemployment
Labor Participation
Family Structure
Vehicle Availability
Education Level
Disability

Single Mother Households Comparison

Immigrants from Hong Kong

Seminole

Exceptional
Tragic
4.8%
SINGLE MOTHER HOUSEHOLDS
100.0/ 100
METRIC RATING
5th/ 347
METRIC RANK
7.4%
SINGLE MOTHER HOUSEHOLDS
0.2/ 100
METRIC RATING
256th/ 347
METRIC RANK

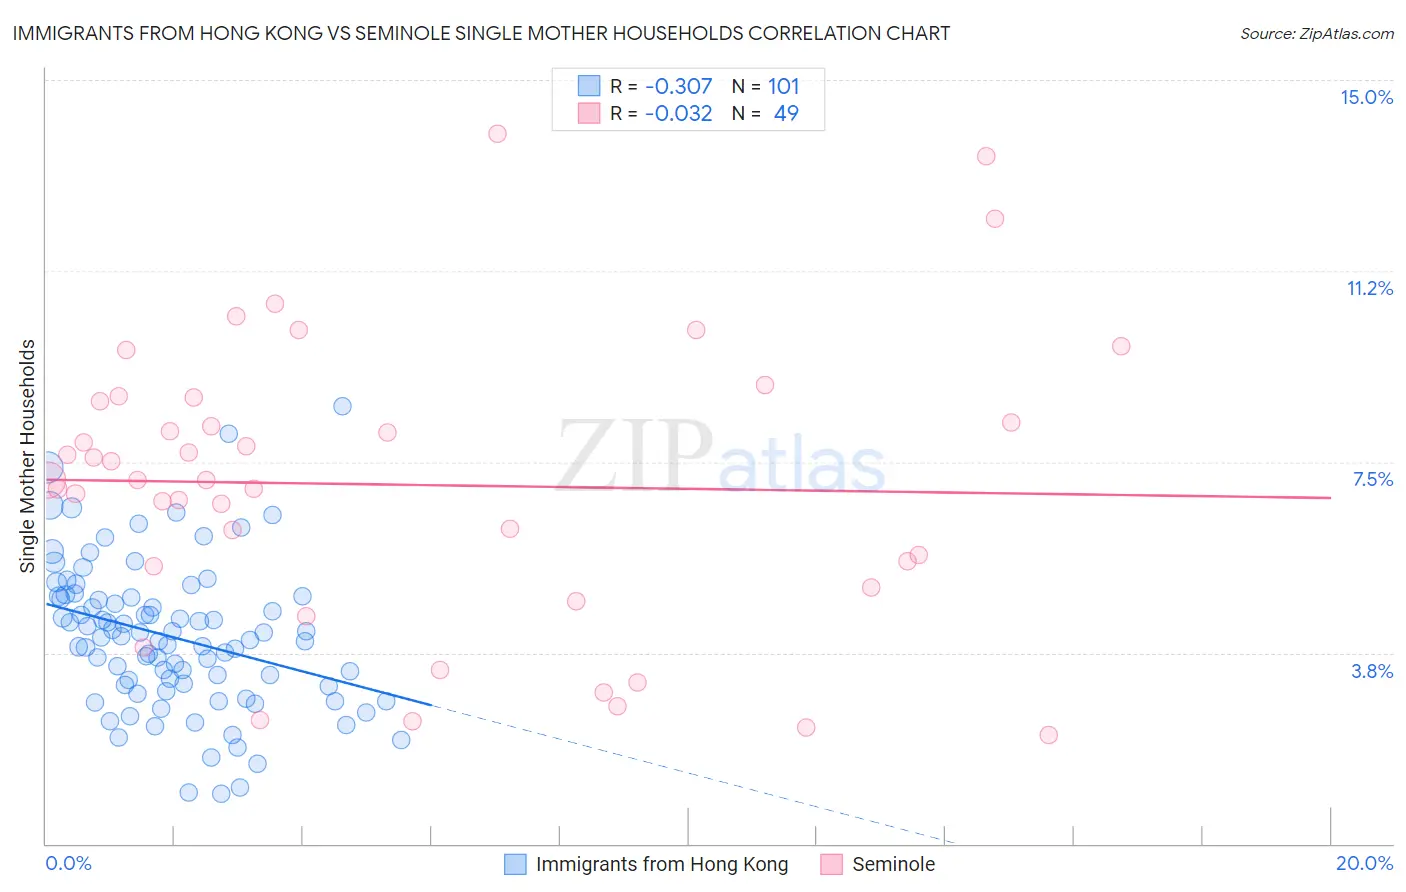
Immigrants from Hong Kong vs Seminole Single Mother Households Correlation Chart

The statistical analysis conducted on geographies consisting of 253,414,911 people shows a mild negative correlation between the proportion of Immigrants from Hong Kong and percentage of single mother households in the United States with a correlation coefficient (R) of -0.307 and weighted average of 4.8%. Similarly, the statistical analysis conducted on geographies consisting of 118,254,419 people shows no correlation between the proportion of Seminole and percentage of single mother households in the United States with a correlation coefficient (R) of -0.032 and weighted average of 7.4%, a difference of 52.9%.
Immigrants from Hong Kong vs Seminole Single Mother Households

Single Mother Households Correlation Summary

MeasurementImmigrants from Hong KongSeminole
Minimum0.98%2.1%
Maximum8.6%13.9%
Range7.6%11.8%
Mean4.1%7.0%
Median4.1%7.2%
Interquartile 25% (IQ1)3.1%5.2%
Interquartile 75% (IQ3)4.8%8.7%
Interquartile Range (IQR)1.7%3.5%
Standard Deviation (Sample)1.4%2.8%
Standard Deviation (Population)1.4%2.8%

Similar Demographics by Single Mother Households

Demographics Similar to Immigrants from Hong Kong by Single Mother Households

In terms of single mother households, the demographic groups most similar to Immigrants from Hong Kong are Assyrian/Chaldean/Syriac (4.8%, a difference of 0.52%), Immigrants from Iran (4.8%, a difference of 0.60%), Immigrants from Singapore (5.0%, a difference of 2.6%), Iranian (5.0%, a difference of 2.8%), and Filipino (4.7%, a difference of 3.0%).
DemographicsRating | RankSingle Mother Households
Immigrants | Taiwan
100.0
/100
|
#1
Exceptional
4.7%
Filipinos
100.0
/100
|
#2
Exceptional
4.7%
Immigrants | Iran
100.0
/100
|
#3
Exceptional
4.8%
Assyrians/Chaldeans/Syriacs
100.0
/100
|
#4
Exceptional
4.8%
Immigrants | Hong Kong
100.0
/100
|
#5
Exceptional
4.8%
Immigrants | Singapore
100.0
/100
|
#6
Exceptional
5.0%
Iranians
100.0
/100
|
#7
Exceptional
5.0%
Immigrants | Ireland
99.9
/100
|
#8
Exceptional
5.0%
Okinawans
99.9
/100
|
#9
Exceptional
5.0%
Immigrants | Israel
99.9
/100
|
#10
Exceptional
5.0%
Immigrants | China
99.9
/100
|
#11
Exceptional
5.1%
Cypriots
99.9
/100
|
#12
Exceptional
5.1%
Immigrants | India
99.9
/100
|
#13
Exceptional
5.1%
Immigrants | Australia
99.9
/100
|
#14
Exceptional
5.1%
Immigrants | Eastern Asia
99.9
/100
|
#15
Exceptional
5.1%

Demographics Similar to Seminole by Single Mother Households

In terms of single mother households, the demographic groups most similar to Seminole are Alaska Native (7.4%, a difference of 0.040%), Pueblo (7.4%, a difference of 0.060%), Immigrants from Yemen (7.4%, a difference of 0.080%), Immigrants from Zaire (7.4%, a difference of 0.13%), and Japanese (7.4%, a difference of 0.15%).
DemographicsRating | RankSingle Mother Households
Bermudans
0.4
/100
|
#249
Tragic
7.3%
Immigrants | Africa
0.4
/100
|
#250
Tragic
7.3%
Malaysians
0.3
/100
|
#251
Tragic
7.3%
Alaskan Athabascans
0.3
/100
|
#252
Tragic
7.3%
Cajuns
0.3
/100
|
#253
Tragic
7.3%
Immigrants | Ecuador
0.3
/100
|
#254
Tragic
7.3%
Mexican American Indians
0.2
/100
|
#255
Tragic
7.4%
Seminole
0.2
/100
|
#256
Tragic
7.4%
Alaska Natives
0.2
/100
|
#257
Tragic
7.4%
Pueblo
0.2
/100
|
#258
Tragic
7.4%
Immigrants | Yemen
0.2
/100
|
#259
Tragic
7.4%
Immigrants | Zaire
0.2
/100
|
#260
Tragic
7.4%
Japanese
0.2
/100
|
#261
Tragic
7.4%
Immigrants | Somalia
0.2
/100
|
#262
Tragic
7.4%
Immigrants | Nicaragua
0.2
/100
|
#263
Tragic
7.4%