Immigrants from Hong Kong vs Nigerian Births to Unmarried Women
COMPARE
Immigrants from Hong Kong
Nigerian
Births to Unmarried Women
Births to Unmarried Women Comparison
Immigrants from Hong Kong
Nigerians
23.6%
BIRTHS TO UNMARRIED WOMEN
100.0/ 100
METRIC RATING
5th/ 347
METRIC RANK
35.3%
BIRTHS TO UNMARRIED WOMEN
0.7/ 100
METRIC RATING
246th/ 347
METRIC RANK
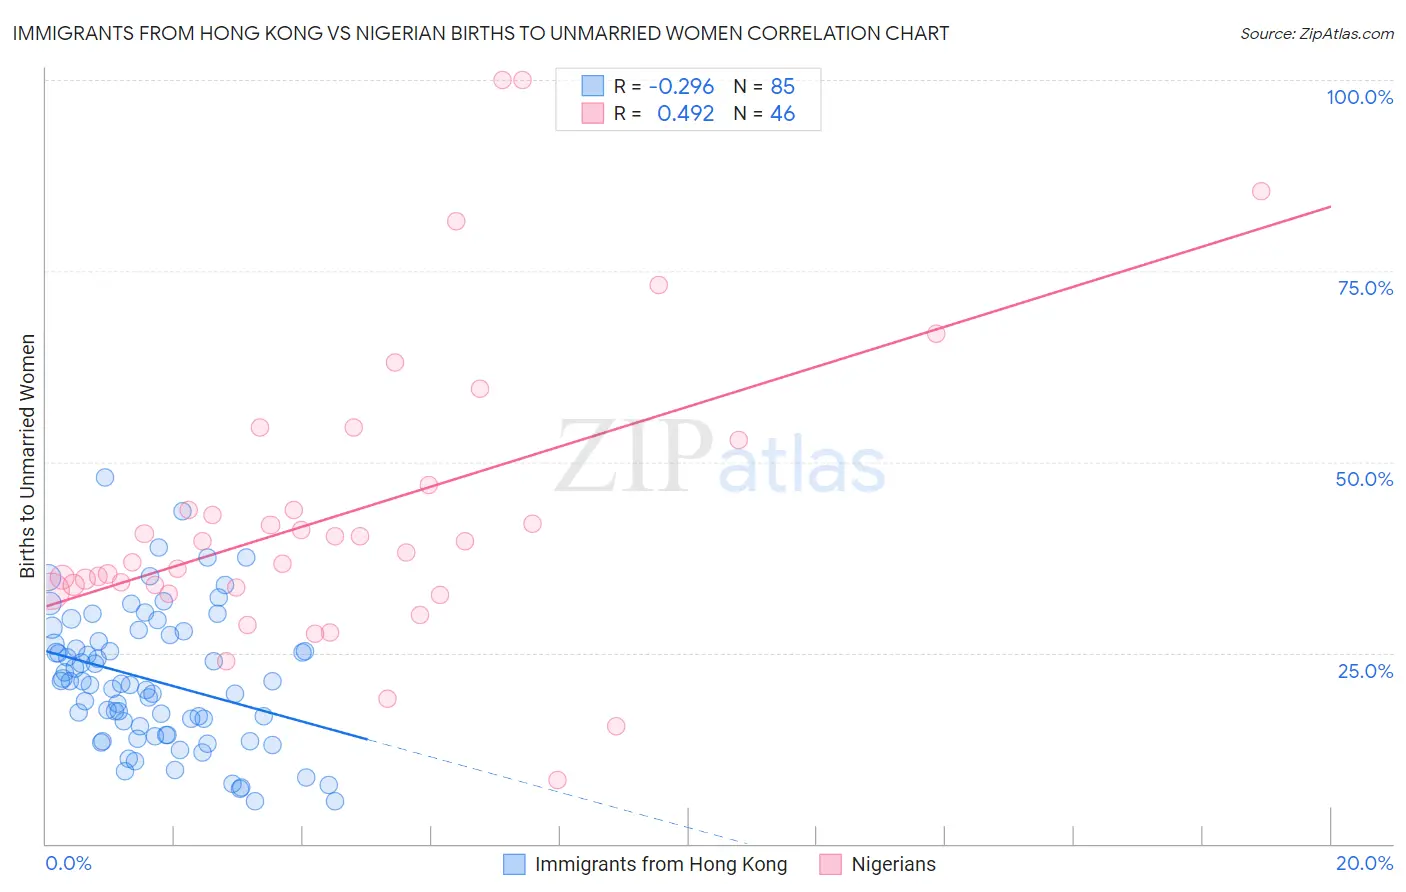
Immigrants from Hong Kong vs Nigerian Births to Unmarried Women Correlation Chart
The statistical analysis conducted on geographies consisting of 239,354,992 people shows a weak negative correlation between the proportion of Immigrants from Hong Kong and percentage of births to unmarried women in the United States with a correlation coefficient (R) of -0.296 and weighted average of 23.6%. Similarly, the statistical analysis conducted on geographies consisting of 318,352,588 people shows a moderate positive correlation between the proportion of Nigerians and percentage of births to unmarried women in the United States with a correlation coefficient (R) of 0.492 and weighted average of 35.3%, a difference of 49.9%.
Births to Unmarried Women Correlation Summary
| Measurement | Immigrants from Hong Kong | Nigerian |
| Minimum | 5.6% | 8.3% |
| Maximum | 48.0% | 100.0% |
| Range | 42.4% | 91.7% |
| Mean | 21.4% | 43.4% |
| Median | 21.0% | 38.8% |
| Interquartile 25% (IQ1) | 14.3% | 33.6% |
| Interquartile 75% (IQ3) | 26.9% | 46.9% |
| Interquartile Range (IQR) | 12.6% | 13.3% |
| Standard Deviation (Sample) | 8.9% | 19.5% |
| Standard Deviation (Population) | 8.8% | 19.3% |
Similar Demographics by Births to Unmarried Women
Demographics Similar to Immigrants from Hong Kong by Births to Unmarried Women
In terms of births to unmarried women, the demographic groups most similar to Immigrants from Hong Kong are Immigrants from Iran (24.0%, a difference of 1.6%), Thai (24.0%, a difference of 1.9%), Immigrants from Taiwan (23.0%, a difference of 2.5%), Filipino (23.0%, a difference of 2.6%), and Immigrants from India (22.9%, a difference of 3.0%).
| Demographics | Rating | Rank | Births to Unmarried Women |
| Assyrians/Chaldeans/Syriacs | 100.0 /100 | #1 | Exceptional 22.0% |
| Immigrants | India | 100.0 /100 | #2 | Exceptional 22.9% |
| Filipinos | 100.0 /100 | #3 | Exceptional 23.0% |
| Immigrants | Taiwan | 100.0 /100 | #4 | Exceptional 23.0% |
| Immigrants | Hong Kong | 100.0 /100 | #5 | Exceptional 23.6% |
| Immigrants | Iran | 100.0 /100 | #6 | Exceptional 24.0% |
| Thais | 100.0 /100 | #7 | Exceptional 24.0% |
| Immigrants | China | 100.0 /100 | #8 | Exceptional 24.7% |
| Immigrants | South Central Asia | 100.0 /100 | #9 | Exceptional 24.7% |
| Immigrants | Eastern Asia | 100.0 /100 | #10 | Exceptional 25.0% |
| Immigrants | Israel | 100.0 /100 | #11 | Exceptional 25.1% |
| Indians (Asian) | 100.0 /100 | #12 | Exceptional 25.3% |
| Iranians | 100.0 /100 | #13 | Exceptional 25.3% |
| Immigrants | Lebanon | 100.0 /100 | #14 | Exceptional 25.3% |
| Immigrants | Singapore | 100.0 /100 | #15 | Exceptional 25.6% |
Demographics Similar to Nigerians by Births to Unmarried Women
In terms of births to unmarried women, the demographic groups most similar to Nigerians are Shoshone (35.3%, a difference of 0.11%), Immigrants from Nigeria (35.4%, a difference of 0.21%), Guyanese (35.2%, a difference of 0.45%), Japanese (35.2%, a difference of 0.51%), and Nonimmigrants (35.5%, a difference of 0.54%).
| Demographics | Rating | Rank | Births to Unmarried Women |
| Sierra Leoneans | 1.4 /100 | #239 | Tragic 34.9% |
| Immigrants | Middle Africa | 1.2 /100 | #240 | Tragic 34.9% |
| Immigrants | Guyana | 1.2 /100 | #241 | Tragic 35.0% |
| Indonesians | 1.2 /100 | #242 | Tragic 35.0% |
| Japanese | 0.9 /100 | #243 | Tragic 35.2% |
| Guyanese | 0.9 /100 | #244 | Tragic 35.2% |
| Shoshone | 0.8 /100 | #245 | Tragic 35.3% |
| Nigerians | 0.7 /100 | #246 | Tragic 35.3% |
| Immigrants | Nigeria | 0.7 /100 | #247 | Tragic 35.4% |
| Immigrants | Nonimmigrants | 0.6 /100 | #248 | Tragic 35.5% |
| Bermudans | 0.6 /100 | #249 | Tragic 35.5% |
| Mexican American Indians | 0.4 /100 | #250 | Tragic 35.7% |
| Immigrants | Western Africa | 0.3 /100 | #251 | Tragic 36.0% |
| Salvadorans | 0.3 /100 | #252 | Tragic 36.0% |
| Immigrants | Portugal | 0.2 /100 | #253 | Tragic 36.2% |