Immigrants from Honduras vs Bahamian Currently Married
COMPARE
Immigrants from Honduras
Bahamian
Currently Married
Currently Married Comparison
Immigrants from Honduras
Bahamians
42.2%
CURRENTLY MARRIED
0.0/ 100
METRIC RATING
298th/ 347
METRIC RANK
41.2%
CURRENTLY MARRIED
0.0/ 100
METRIC RATING
318th/ 347
METRIC RANK
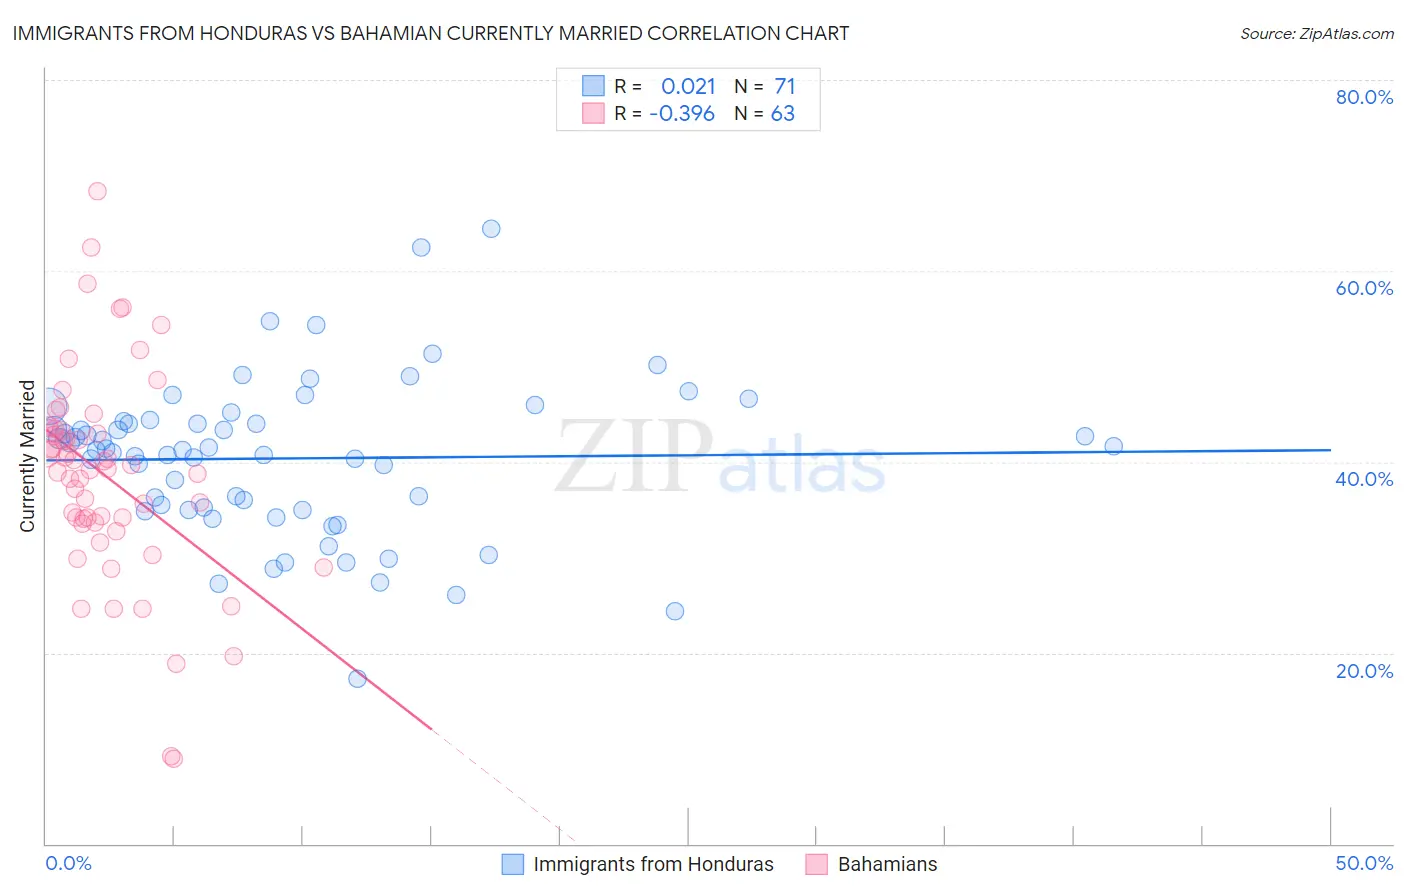
Immigrants from Honduras vs Bahamian Currently Married Correlation Chart
The statistical analysis conducted on geographies consisting of 322,599,872 people shows no correlation between the proportion of Immigrants from Honduras and percentage of population currently married in the United States with a correlation coefficient (R) of 0.021 and weighted average of 42.2%. Similarly, the statistical analysis conducted on geographies consisting of 112,687,531 people shows a mild negative correlation between the proportion of Bahamians and percentage of population currently married in the United States with a correlation coefficient (R) of -0.396 and weighted average of 41.2%, a difference of 2.5%.
Currently Married Correlation Summary
| Measurement | Immigrants from Honduras | Bahamian |
| Minimum | 17.3% | 8.9% |
| Maximum | 64.4% | 68.3% |
| Range | 47.1% | 59.4% |
| Mean | 40.4% | 38.6% |
| Median | 41.2% | 39.3% |
| Interquartile 25% (IQ1) | 34.9% | 33.7% |
| Interquartile 75% (IQ3) | 44.3% | 43.5% |
| Interquartile Range (IQR) | 9.3% | 9.8% |
| Standard Deviation (Sample) | 8.2% | 10.9% |
| Standard Deviation (Population) | 8.1% | 10.9% |
Demographics Similar to Immigrants from Honduras and Bahamians by Currently Married
In terms of currently married, the demographic groups most similar to Immigrants from Honduras are Liberian (42.2%, a difference of 0.030%), Belizean (42.2%, a difference of 0.13%), Immigrants from Yemen (42.1%, a difference of 0.37%), Immigrants from Zaire (42.0%, a difference of 0.62%), and Sioux (41.9%, a difference of 0.63%). Similarly, the demographic groups most similar to Bahamians are Haitian (41.3%, a difference of 0.18%), Immigrants from Caribbean (41.3%, a difference of 0.20%), Inupiat (41.3%, a difference of 0.26%), West Indian (41.3%, a difference of 0.35%), and Jamaican (41.4%, a difference of 0.42%).
| Demographics | Rating | Rank | Currently Married |
| Immigrants | Honduras | 0.0 /100 | #298 | Tragic 42.2% |
| Liberians | 0.0 /100 | #299 | Tragic 42.2% |
| Belizeans | 0.0 /100 | #300 | Tragic 42.2% |
| Immigrants | Yemen | 0.0 /100 | #301 | Tragic 42.1% |
| Immigrants | Zaire | 0.0 /100 | #302 | Tragic 42.0% |
| Sioux | 0.0 /100 | #303 | Tragic 41.9% |
| Immigrants | Bahamas | 0.0 /100 | #304 | Tragic 41.9% |
| Immigrants | Trinidad and Tobago | 0.0 /100 | #305 | Tragic 41.9% |
| Immigrants | Guyana | 0.0 /100 | #306 | Tragic 41.9% |
| Africans | 0.0 /100 | #307 | Tragic 41.8% |
| Immigrants | Belize | 0.0 /100 | #308 | Tragic 41.8% |
| Immigrants | Liberia | 0.0 /100 | #309 | Tragic 41.8% |
| Guyanese | 0.0 /100 | #310 | Tragic 41.6% |
| Trinidadians and Tobagonians | 0.0 /100 | #311 | Tragic 41.5% |
| Somalis | 0.0 /100 | #312 | Tragic 41.5% |
| Jamaicans | 0.0 /100 | #313 | Tragic 41.4% |
| West Indians | 0.0 /100 | #314 | Tragic 41.3% |
| Inupiat | 0.0 /100 | #315 | Tragic 41.3% |
| Immigrants | Caribbean | 0.0 /100 | #316 | Tragic 41.3% |
| Haitians | 0.0 /100 | #317 | Tragic 41.3% |
| Bahamians | 0.0 /100 | #318 | Tragic 41.2% |