Immigrants from Guyana vs Egyptian Births to Unmarried Women
COMPARE
Immigrants from Guyana
Egyptian
Births to Unmarried Women
Births to Unmarried Women Comparison
Immigrants from Guyana
Egyptians
35.0%
BIRTHS TO UNMARRIED WOMEN
1.2/ 100
METRIC RATING
241st/ 347
METRIC RANK
28.2%
BIRTHS TO UNMARRIED WOMEN
99.0/ 100
METRIC RATING
62nd/ 347
METRIC RANK
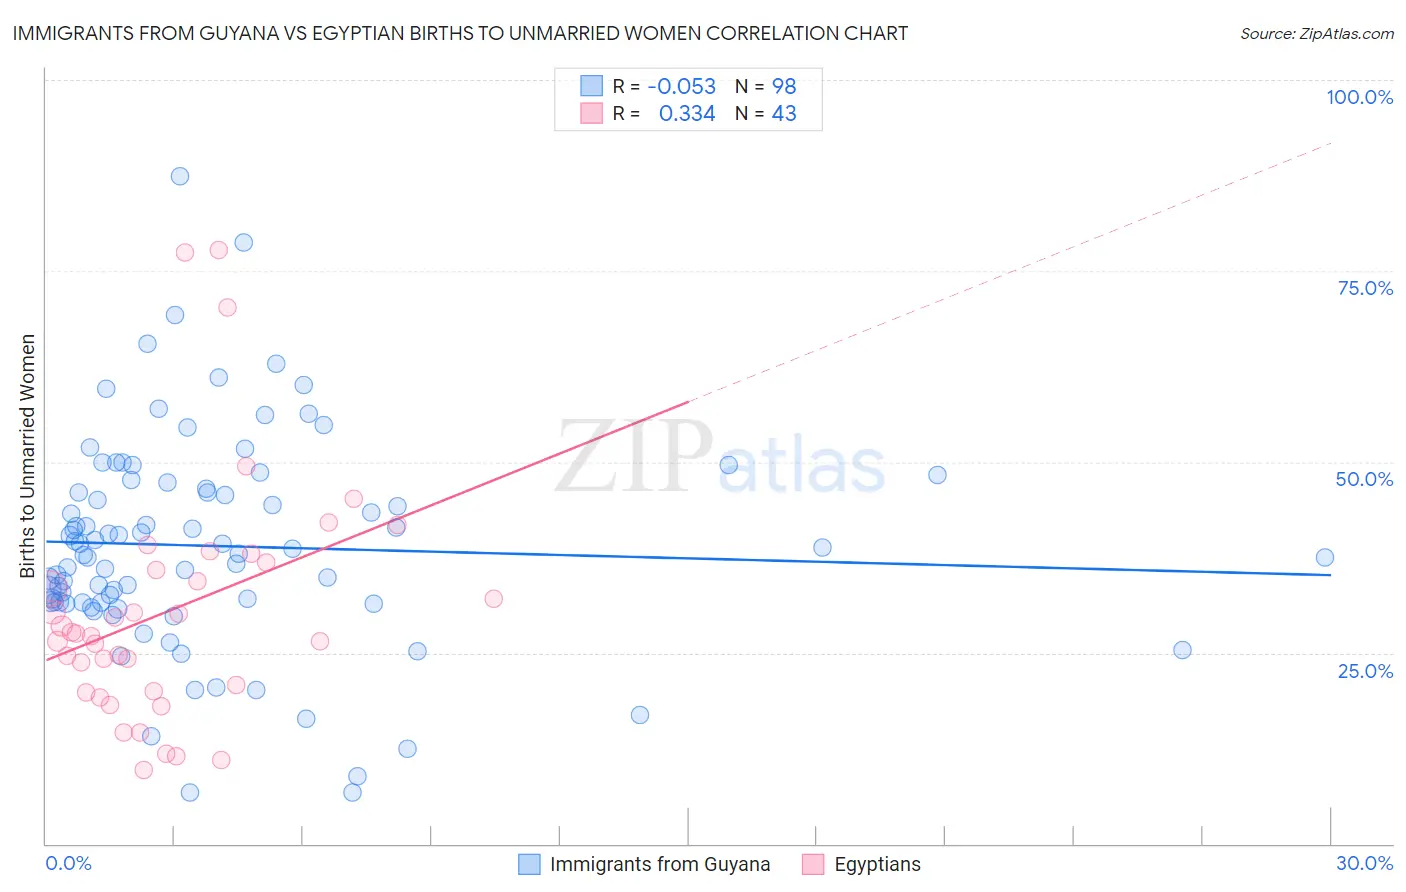
Immigrants from Guyana vs Egyptian Births to Unmarried Women Correlation Chart
The statistical analysis conducted on geographies consisting of 177,005,491 people shows a slight negative correlation between the proportion of Immigrants from Guyana and percentage of births to unmarried women in the United States with a correlation coefficient (R) of -0.053 and weighted average of 35.0%. Similarly, the statistical analysis conducted on geographies consisting of 261,953,524 people shows a mild positive correlation between the proportion of Egyptians and percentage of births to unmarried women in the United States with a correlation coefficient (R) of 0.334 and weighted average of 28.2%, a difference of 23.8%.
Births to Unmarried Women Correlation Summary
| Measurement | Immigrants from Guyana | Egyptian |
| Minimum | 6.7% | 9.6% |
| Maximum | 87.4% | 77.8% |
| Range | 80.7% | 68.2% |
| Mean | 39.0% | 30.5% |
| Median | 38.4% | 27.5% |
| Interquartile 25% (IQ1) | 31.6% | 20.0% |
| Interquartile 75% (IQ3) | 46.5% | 36.9% |
| Interquartile Range (IQR) | 14.9% | 16.9% |
| Standard Deviation (Sample) | 14.0% | 15.6% |
| Standard Deviation (Population) | 14.0% | 15.4% |
Similar Demographics by Births to Unmarried Women
Demographics Similar to Immigrants from Guyana by Births to Unmarried Women
In terms of births to unmarried women, the demographic groups most similar to Immigrants from Guyana are Immigrants from Middle Africa (34.9%, a difference of 0.030%), Indonesian (35.0%, a difference of 0.10%), Sierra Leonean (34.9%, a difference of 0.28%), Immigrants from Cambodia (34.8%, a difference of 0.51%), and Marshallese (34.8%, a difference of 0.57%).
| Demographics | Rating | Rank | Births to Unmarried Women |
| Immigrants | Zaire | 2.3 /100 | #234 | Tragic 34.5% |
| Immigrants | Ghana | 2.2 /100 | #235 | Tragic 34.5% |
| Immigrants | Cameroon | 1.6 /100 | #236 | Tragic 34.7% |
| Marshallese | 1.6 /100 | #237 | Tragic 34.8% |
| Immigrants | Cambodia | 1.6 /100 | #238 | Tragic 34.8% |
| Sierra Leoneans | 1.4 /100 | #239 | Tragic 34.9% |
| Immigrants | Middle Africa | 1.2 /100 | #240 | Tragic 34.9% |
| Immigrants | Guyana | 1.2 /100 | #241 | Tragic 35.0% |
| Indonesians | 1.2 /100 | #242 | Tragic 35.0% |
| Japanese | 0.9 /100 | #243 | Tragic 35.2% |
| Guyanese | 0.9 /100 | #244 | Tragic 35.2% |
| Shoshone | 0.8 /100 | #245 | Tragic 35.3% |
| Nigerians | 0.7 /100 | #246 | Tragic 35.3% |
| Immigrants | Nigeria | 0.7 /100 | #247 | Tragic 35.4% |
| Immigrants | Nonimmigrants | 0.6 /100 | #248 | Tragic 35.5% |
Demographics Similar to Egyptians by Births to Unmarried Women
In terms of births to unmarried women, the demographic groups most similar to Egyptians are Immigrants from Serbia (28.3%, a difference of 0.14%), Immigrants from North Macedonia (28.1%, a difference of 0.32%), Immigrants from Turkey (28.1%, a difference of 0.36%), Immigrants from Kazakhstan (28.1%, a difference of 0.41%), and Tongan (28.4%, a difference of 0.53%).
| Demographics | Rating | Rank | Births to Unmarried Women |
| Mongolians | 99.3 /100 | #55 | Exceptional 27.9% |
| Immigrants | Belgium | 99.3 /100 | #56 | Exceptional 28.0% |
| Russians | 99.2 /100 | #57 | Exceptional 28.0% |
| Immigrants | Albania | 99.2 /100 | #58 | Exceptional 28.0% |
| Immigrants | Kazakhstan | 99.1 /100 | #59 | Exceptional 28.1% |
| Immigrants | Turkey | 99.1 /100 | #60 | Exceptional 28.1% |
| Immigrants | North Macedonia | 99.1 /100 | #61 | Exceptional 28.1% |
| Egyptians | 99.0 /100 | #62 | Exceptional 28.2% |
| Immigrants | Serbia | 98.9 /100 | #63 | Exceptional 28.3% |
| Tongans | 98.8 /100 | #64 | Exceptional 28.4% |
| Immigrants | Czechoslovakia | 98.8 /100 | #65 | Exceptional 28.4% |
| Immigrants | Egypt | 98.8 /100 | #66 | Exceptional 28.4% |
| Palestinians | 98.7 /100 | #67 | Exceptional 28.4% |
| Immigrants | Europe | 98.7 /100 | #68 | Exceptional 28.4% |
| Bolivians | 98.7 /100 | #69 | Exceptional 28.5% |