Immigrants from Ghana vs Samoan Divorced or Separated

COMPARE

Immigrants from Ghana
Race
Ancestry
AfghanAfricanAlaska NativeAlaskan AthabascanAlbanianAleutAlsatianAmericanApacheArabArapahoArgentineanArmenianAssyrian/Chaldean/SyriacAustralianAustrianBahamianBangladeshiBarbadianBasqueBelgianBelizeanBermudanBhutaneseBlackfeetBolivianBrazilianBritishBritish West IndianBulgarianBurmeseCajunCambodianCanadianCape VerdeanCarpatho RusynCelticCentral AmericanCentral American IndianCherokeeCheyenneChickasawChileanChineseChippewaChoctawColombianColvilleComancheCosta RicanCreeCreekCroatianCrowCubanCypriotCzechCzechoslovakianDanishDelawareDominicanDutchDutch West IndianEastern EuropeanEcuadorianEgyptianEnglishEstonianEthiopianEuropeanFijianFilipinoFinnishFrenchFrench American IndianFrench CanadianGermanGerman RussianGhanaianGreekGuamanian/ChamorroGuatemalanGuyaneseHaitianHmongHonduranHopiHoumaHungarianIcelanderIndian (Asian)IndonesianInupiatIranianIraqiIrishIroquoisIsraeliItalianJamaicanJapaneseJordanianKenyanKiowaKoreanLaotianLatvianLebaneseLiberianLithuanianLumbeeLuxembourgerMacedonianMalaysianMalteseMarshalleseMenomineeMexicanMexican American IndianMongolianMoroccanNative HawaiianNavajoNepaleseNew ZealanderNicaraguanNigerianNorthern EuropeanNorwegianOkinawanOsageOttawaPaiutePakistaniPalestinianPanamanianParaguayanPennsylvania GermanPeruvianPimaPolishPortuguesePotawatomiPuebloPuerto RicanPuget Sound SalishRomanianRussianSalvadoranScandinavianScotch-IrishScottishSeminoleSenegaleseSerbianShoshoneSierra LeoneanSiouxSlavicSlovakSloveneSomaliSouth AfricanSouth AmericanSouth American IndianSoviet UnionSpaniardSpanishSpanish AmericanSpanish American IndianSri LankanSubsaharan AfricanSudaneseSwedishSwissSyrianTaiwaneseThaiTlingit-HaidaTohono O'OdhamTonganTrinidadian and TobagonianTsimshianTurkishU.S. Virgin IslanderUgandanUkrainianUruguayanUteVenezuelanVietnameseWelshWest IndianYakamaYaquiYugoslavianYumanYup'ikZimbabwean
Immigration
NonimmigrantsImmigrantsAfghanistanAfricaAlbaniaArgentinaArmeniaAsiaAustraliaAustriaBahamasBangladeshBarbadosBelarusBelgiumBelizeBoliviaBosnia and HerzegovinaBrazilBulgariaBurma/MyanmarCabo VerdeCambodiaCameroonCanadaCaribbeanCentral AmericaChileChinaColombiaCongoCosta RicaCroatiaCubaCzechoslovakiaDenmarkDominicaDominican RepublicEastern AfricaEastern AsiaEastern EuropeEcuadorEgyptEl SalvadorEnglandEritreaEthiopiaEuropeFijiFranceGermanyGhanaGreeceGrenadaGuatemalaGuyanaHaitiHondurasHong KongHungaryIndiaIndonesiaIranIraqIrelandIsraelItalyJamaicaJapanJordanKazakhstanKenyaKoreaKuwaitLaosLatin AmericaLatviaLebanonLiberiaLithuaniaMalaysiaMexicoMicronesiaMiddle AfricaMoldovaMoroccoNepalNetherlandsNicaraguaNigeriaNorth AmericaNorth MacedoniaNorthern AfricaNorthern EuropeNorwayOceaniaPakistanPanamaPeruPhilippinesPolandPortugalRomaniaRussiaSaudi ArabiaScotlandSenegalSerbiaSierra LeoneSingaporeSomaliaSouth AfricaSouth AmericaSouth Central AsiaSouth Eastern AsiaSouthern EuropeSpainSri LankaSt. Vincent and the GrenadinesSudanSwedenSwitzerlandSyriaTaiwanThailandTrinidad and TobagoTurkeyUgandaUkraineUruguayUzbekistanVenezuelaVietnamWest IndiesWestern AfricaWestern AsiaWestern EuropeYemenZaireZimbabweAzores
Samoan
Race
Ancestry
AfghanAfricanAlaska NativeAlaskan AthabascanAlbanianAleutAlsatianAmericanApacheArabArapahoArgentineanArmenianAssyrian/Chaldean/SyriacAustralianAustrianBahamianBangladeshiBarbadianBasqueBelgianBelizeanBermudanBhutaneseBlackfeetBolivianBrazilianBritishBritish West IndianBulgarianBurmeseCajunCambodianCanadianCape VerdeanCarpatho RusynCelticCentral AmericanCentral American IndianCherokeeCheyenneChickasawChileanChineseChippewaChoctawColombianColvilleComancheCosta RicanCreeCreekCroatianCrowCubanCypriotCzechCzechoslovakianDanishDelawareDominicanDutchDutch West IndianEastern EuropeanEcuadorianEgyptianEnglishEstonianEthiopianEuropeanFijianFilipinoFinnishFrenchFrench American IndianFrench CanadianGermanGerman RussianGhanaianGreekGuamanian/ChamorroGuatemalanGuyaneseHaitianHmongHonduranHopiHoumaHungarianIcelanderIndian (Asian)IndonesianInupiatIranianIraqiIrishIroquoisIsraeliItalianJamaicanJapaneseJordanianKenyanKiowaKoreanLaotianLatvianLebaneseLiberianLithuanianLumbeeLuxembourgerMacedonianMalaysianMalteseMarshalleseMenomineeMexicanMexican American IndianMongolianMoroccanNative HawaiianNavajoNepaleseNew ZealanderNicaraguanNigerianNorthern EuropeanNorwegianOkinawanOsageOttawaPaiutePakistaniPalestinianPanamanianParaguayanPennsylvania GermanPeruvianPimaPolishPortuguesePotawatomiPuebloPuerto RicanPuget Sound SalishRomanianRussianSalvadoranSamoanScandinavianScotch-IrishScottishSeminoleSenegaleseSerbianShoshoneSierra LeoneanSiouxSlavicSlovakSloveneSomaliSouth AfricanSouth AmericanSouth American IndianSoviet UnionSpaniardSpanishSpanish AmericanSpanish American IndianSri LankanSubsaharan AfricanSudaneseSwedishSwissSyrianTaiwaneseThaiTlingit-HaidaTohono O'OdhamTonganTrinidadian and TobagonianTsimshianTurkishU.S. Virgin IslanderUgandanUkrainianUruguayanUteVenezuelanVietnameseWelshWest IndianYakamaYaquiYugoslavianYumanYup'ikZimbabwean
Immigration
NonimmigrantsImmigrantsAfghanistanAfricaAlbaniaArgentinaArmeniaAsiaAustraliaAustriaBahamasBangladeshBarbadosBelarusBelgiumBelizeBoliviaBosnia and HerzegovinaBrazilBulgariaBurma/MyanmarCabo VerdeCambodiaCameroonCanadaCaribbeanCentral AmericaChileChinaColombiaCongoCosta RicaCroatiaCubaCzechoslovakiaDenmarkDominicaDominican RepublicEastern AfricaEastern AsiaEastern EuropeEcuadorEgyptEl SalvadorEnglandEritreaEthiopiaEuropeFijiFranceGermanyGreeceGrenadaGuatemalaGuyanaHaitiHondurasHong KongHungaryIndiaIndonesiaIranIraqIrelandIsraelItalyJamaicaJapanJordanKazakhstanKenyaKoreaKuwaitLaosLatin AmericaLatviaLebanonLiberiaLithuaniaMalaysiaMexicoMicronesiaMiddle AfricaMoldovaMoroccoNepalNetherlandsNicaraguaNigeriaNorth AmericaNorth MacedoniaNorthern AfricaNorthern EuropeNorwayOceaniaPakistanPanamaPeruPhilippinesPolandPortugalRomaniaRussiaSaudi ArabiaScotlandSenegalSerbiaSierra LeoneSingaporeSomaliaSouth AfricaSouth AmericaSouth Central AsiaSouth Eastern AsiaSouthern EuropeSpainSri LankaSt. Vincent and the GrenadinesSudanSwedenSwitzerlandSyriaTaiwanThailandTrinidad and TobagoTurkeyUgandaUkraineUruguayUzbekistanVenezuelaVietnamWest IndiesWestern AfricaWestern AsiaWestern EuropeYemenZaireZimbabweAzores
Divorced or Separated
Income
Poverty
Unemployment
Labor Participation
Family Structure
Vehicle Availability
Education Level
Disability

Divorced or Separated Comparison

Immigrants from Ghana

Samoans

Poor
Good
12.2%
DIVORCED OR SEPARATED
18.8/ 100
METRIC RATING
208th/ 347
METRIC RANK
12.0%
DIVORCED OR SEPARATED
64.3/ 100
METRIC RATING
162nd/ 347
METRIC RANK

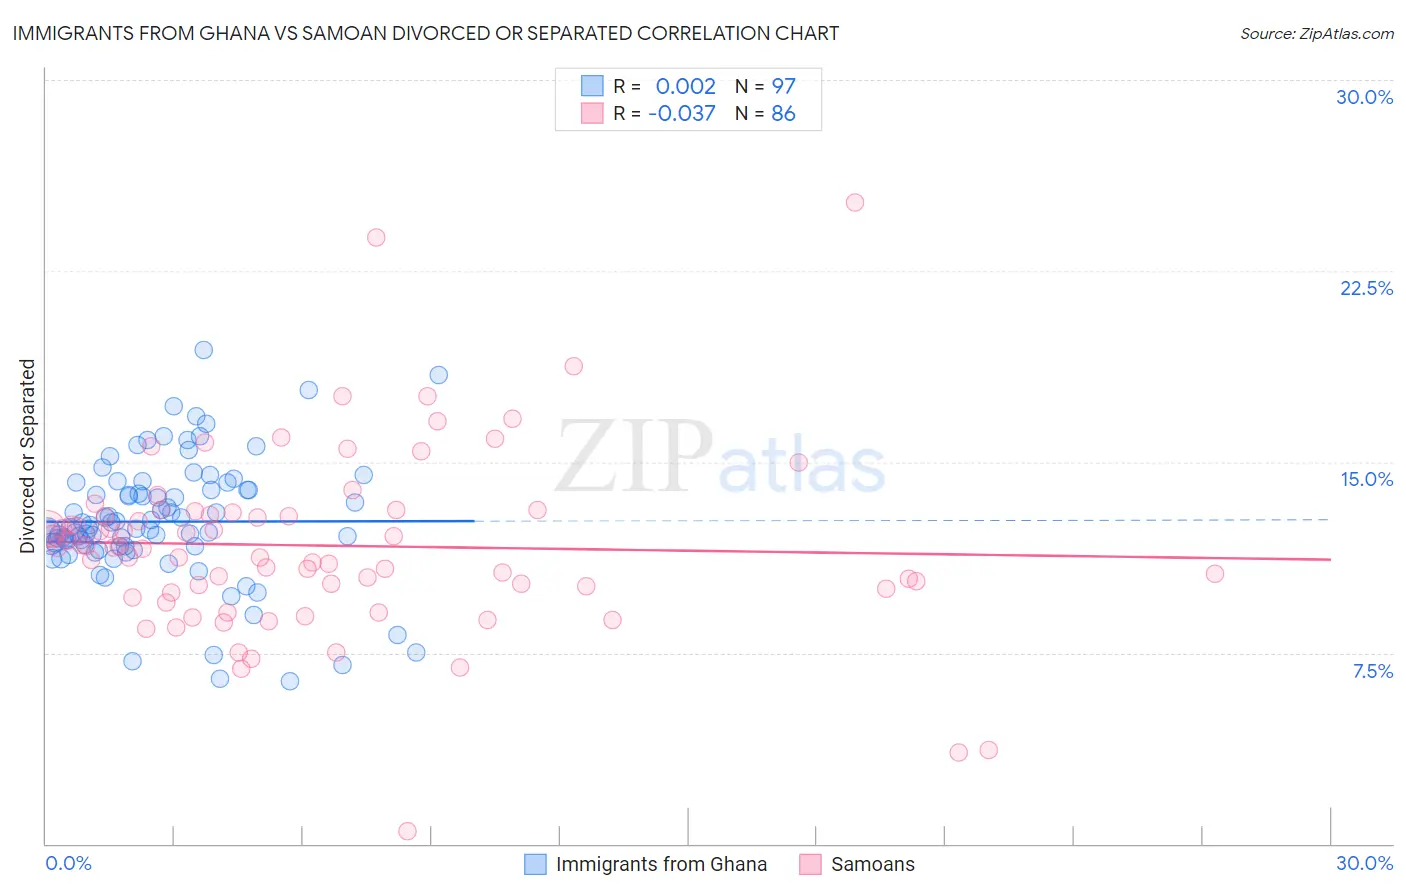
Immigrants from Ghana vs Samoan Divorced or Separated Correlation Chart

The statistical analysis conducted on geographies consisting of 199,867,447 people shows no correlation between the proportion of Immigrants from Ghana and percentage of population currently divorced or separated in the United States with a correlation coefficient (R) of 0.002 and weighted average of 12.2%. Similarly, the statistical analysis conducted on geographies consisting of 225,171,159 people shows no correlation between the proportion of Samoans and percentage of population currently divorced or separated in the United States with a correlation coefficient (R) of -0.037 and weighted average of 12.0%, a difference of 1.8%.
Immigrants from Ghana vs Samoan Divorced or Separated

Divorced or Separated Correlation Summary

MeasurementImmigrants from GhanaSamoan
Minimum6.4%0.50%
Maximum19.4%25.2%
Range13.0%24.7%
Mean12.7%11.7%
Median12.4%11.7%
Interquartile 25% (IQ1)11.7%10.0%
Interquartile 75% (IQ3)13.9%13.0%
Interquartile Range (IQR)2.2%3.0%
Standard Deviation (Sample)2.4%3.6%
Standard Deviation (Population)2.4%3.6%

Similar Demographics by Divorced or Separated

Demographics Similar to Immigrants from Ghana by Divorced or Separated

In terms of divorced or separated, the demographic groups most similar to Immigrants from Ghana are Immigrants from Trinidad and Tobago (12.2%, a difference of 0.050%), Slavic (12.2%, a difference of 0.11%), Slovak (12.2%, a difference of 0.12%), Mexican (12.2%, a difference of 0.12%), and Immigrants from Costa Rica (12.2%, a difference of 0.13%).
DemographicsRating | RankDivorced or Separated
Guatemalans
26.9
/100
|
#201
Fair
12.2%
Portuguese
23.5
/100
|
#202
Fair
12.2%
Immigrants | Guatemala
23.2
/100
|
#203
Fair
12.2%
Kenyans
21.8
/100
|
#204
Fair
12.2%
Immigrants | Costa Rica
21.3
/100
|
#205
Fair
12.2%
Slovaks
21.0
/100
|
#206
Fair
12.2%
Mexicans
21.0
/100
|
#207
Fair
12.2%
Immigrants | Ghana
18.8
/100
|
#208
Poor
12.2%
Immigrants | Trinidad and Tobago
17.8
/100
|
#209
Poor
12.2%
Slavs
17.0
/100
|
#210
Poor
12.2%
Trinidadians and Tobagonians
16.6
/100
|
#211
Poor
12.2%
Immigrants | Kenya
16.5
/100
|
#212
Poor
12.2%
Immigrants | Eastern Africa
16.2
/100
|
#213
Poor
12.2%
Immigrants | Argentina
15.5
/100
|
#214
Poor
12.2%
Europeans
15.4
/100
|
#215
Poor
12.2%

Demographics Similar to Samoans by Divorced or Separated

In terms of divorced or separated, the demographic groups most similar to Samoans are Marshallese (12.0%, a difference of 0.010%), Navajo (12.0%, a difference of 0.010%), Swiss (12.0%, a difference of 0.020%), Immigrants from Scotland (12.0%, a difference of 0.060%), and Icelander (12.0%, a difference of 0.070%).
DemographicsRating | RankDivorced or Separated
Japanese
70.9
/100
|
#155
Good
12.0%
Hungarians
70.3
/100
|
#156
Good
12.0%
Immigrants | Brazil
68.8
/100
|
#157
Good
12.0%
Icelanders
66.0
/100
|
#158
Good
12.0%
Immigrants | Barbados
66.0
/100
|
#159
Good
12.0%
Immigrants | Scotland
65.8
/100
|
#160
Good
12.0%
Marshallese
64.6
/100
|
#161
Good
12.0%
Samoans
64.3
/100
|
#162
Good
12.0%
Navajo
63.9
/100
|
#163
Good
12.0%
Swiss
63.6
/100
|
#164
Good
12.0%
German Russians
61.8
/100
|
#165
Good
12.0%
Tohono O'odham
60.4
/100
|
#166
Good
12.0%
Ethiopians
58.5
/100
|
#167
Average
12.0%
Serbians
57.1
/100
|
#168
Average
12.0%
Immigrants | Peru
57.0
/100
|
#169
Average
12.0%