Immigrants from Germany vs Soviet Union Family Households with Children

COMPARE

Immigrants from Germany
Race
Ancestry
AfghanAfricanAlaska NativeAlaskan AthabascanAlbanianAleutAlsatianAmericanApacheArabArapahoArgentineanArmenianAssyrian/Chaldean/SyriacAustralianAustrianBahamianBangladeshiBarbadianBasqueBelgianBelizeanBermudanBhutaneseBlackfeetBolivianBrazilianBritishBritish West IndianBulgarianBurmeseCajunCambodianCanadianCape VerdeanCarpatho RusynCelticCentral AmericanCentral American IndianCherokeeCheyenneChickasawChileanChineseChippewaChoctawColombianColvilleComancheCosta RicanCreeCreekCroatianCrowCubanCypriotCzechCzechoslovakianDanishDelawareDominicanDutchDutch West IndianEastern EuropeanEcuadorianEgyptianEnglishEstonianEthiopianEuropeanFijianFilipinoFinnishFrenchFrench American IndianFrench CanadianGermanGerman RussianGhanaianGreekGuamanian/ChamorroGuatemalanGuyaneseHaitianHmongHonduranHopiHoumaHungarianIcelanderIndian (Asian)IndonesianInupiatIranianIraqiIrishIroquoisIsraeliItalianJamaicanJapaneseJordanianKenyanKiowaKoreanLaotianLatvianLebaneseLiberianLithuanianLumbeeLuxembourgerMacedonianMalaysianMalteseMarshalleseMenomineeMexicanMexican American IndianMongolianMoroccanNative HawaiianNavajoNepaleseNew ZealanderNicaraguanNigerianNorthern EuropeanNorwegianOkinawanOsageOttawaPaiutePakistaniPalestinianPanamanianParaguayanPennsylvania GermanPeruvianPimaPolishPortuguesePotawatomiPuebloPuerto RicanPuget Sound SalishRomanianRussianSalvadoranSamoanScandinavianScotch-IrishScottishSeminoleSenegaleseSerbianShoshoneSierra LeoneanSiouxSlavicSlovakSloveneSomaliSouth AfricanSouth AmericanSouth American IndianSpaniardSpanishSpanish AmericanSpanish American IndianSri LankanSubsaharan AfricanSudaneseSwedishSwissSyrianTaiwaneseThaiTlingit-HaidaTohono O'OdhamTonganTrinidadian and TobagonianTsimshianTurkishU.S. Virgin IslanderUgandanUkrainianUruguayanUteVenezuelanVietnameseWelshWest IndianYakamaYaquiYugoslavianYumanYup'ikZimbabwean
Immigration
NonimmigrantsImmigrantsAfghanistanAfricaAlbaniaArgentinaArmeniaAsiaAustraliaAustriaBahamasBangladeshBarbadosBelarusBelgiumBelizeBoliviaBosnia and HerzegovinaBrazilBulgariaBurma/MyanmarCabo VerdeCambodiaCameroonCanadaCaribbeanCentral AmericaChileChinaColombiaCongoCosta RicaCroatiaCubaCzechoslovakiaDenmarkDominicaDominican RepublicEastern AfricaEastern AsiaEastern EuropeEcuadorEgyptEl SalvadorEnglandEritreaEthiopiaEuropeFijiFranceGermanyGhanaGreeceGrenadaGuatemalaGuyanaHaitiHondurasHong KongHungaryIndiaIndonesiaIranIraqIrelandIsraelItalyJamaicaJapanJordanKazakhstanKenyaKoreaKuwaitLaosLatin AmericaLatviaLebanonLiberiaLithuaniaMalaysiaMexicoMicronesiaMiddle AfricaMoldovaMoroccoNepalNetherlandsNicaraguaNigeriaNorth AmericaNorth MacedoniaNorthern AfricaNorthern EuropeNorwayOceaniaPakistanPanamaPeruPhilippinesPolandPortugalRomaniaRussiaSaudi ArabiaScotlandSenegalSerbiaSierra LeoneSingaporeSomaliaSouth AfricaSouth AmericaSouth Central AsiaSouth Eastern AsiaSouthern EuropeSpainSri LankaSt. Vincent and the GrenadinesSudanSwedenSwitzerlandSyriaTaiwanThailandTrinidad and TobagoTurkeyUgandaUkraineUruguayUzbekistanVenezuelaVietnamWest IndiesWestern AfricaWestern AsiaWestern EuropeYemenZaireZimbabweAzores
Soviet Union
Race
Ancestry
AfghanAfricanAlaska NativeAlaskan AthabascanAlbanianAleutAlsatianAmericanApacheArabArapahoArgentineanArmenianAssyrian/Chaldean/SyriacAustralianAustrianBahamianBangladeshiBarbadianBasqueBelgianBelizeanBermudanBhutaneseBlackfeetBolivianBrazilianBritishBritish West IndianBulgarianBurmeseCajunCambodianCanadianCape VerdeanCarpatho RusynCelticCentral AmericanCentral American IndianCherokeeCheyenneChickasawChileanChineseChippewaChoctawColombianColvilleComancheCosta RicanCreeCreekCroatianCrowCubanCypriotCzechCzechoslovakianDanishDelawareDominicanDutchDutch West IndianEastern EuropeanEcuadorianEgyptianEnglishEstonianEthiopianEuropeanFijianFilipinoFinnishFrenchFrench American IndianFrench CanadianGermanGerman RussianGhanaianGreekGuamanian/ChamorroGuatemalanGuyaneseHaitianHmongHonduranHopiHoumaHungarianIcelanderIndian (Asian)IndonesianInupiatIranianIraqiIrishIroquoisIsraeliItalianJamaicanJapaneseJordanianKenyanKiowaKoreanLaotianLatvianLebaneseLiberianLithuanianLumbeeLuxembourgerMacedonianMalaysianMalteseMarshalleseMenomineeMexicanMexican American IndianMongolianMoroccanNative HawaiianNavajoNepaleseNew ZealanderNicaraguanNigerianNorthern EuropeanNorwegianOkinawanOsageOttawaPaiutePakistaniPalestinianPanamanianParaguayanPennsylvania GermanPeruvianPimaPolishPortuguesePotawatomiPuebloPuerto RicanPuget Sound SalishRomanianRussianSalvadoranSamoanScandinavianScotch-IrishScottishSeminoleSenegaleseSerbianShoshoneSierra LeoneanSiouxSlavicSlovakSloveneSomaliSouth AfricanSouth AmericanSouth American IndianSoviet UnionSpaniardSpanishSpanish AmericanSpanish American IndianSri LankanSubsaharan AfricanSudaneseSwedishSwissSyrianTaiwaneseThaiTlingit-HaidaTohono O'OdhamTonganTrinidadian and TobagonianTsimshianTurkishU.S. Virgin IslanderUgandanUkrainianUruguayanUteVenezuelanVietnameseWelshWest IndianYakamaYaquiYugoslavianYumanYup'ikZimbabwean
Immigration
NonimmigrantsImmigrantsAfghanistanAfricaAlbaniaArgentinaArmeniaAsiaAustraliaAustriaBahamasBangladeshBarbadosBelarusBelgiumBelizeBoliviaBosnia and HerzegovinaBrazilBulgariaBurma/MyanmarCabo VerdeCambodiaCameroonCanadaCaribbeanCentral AmericaChileChinaColombiaCongoCosta RicaCroatiaCubaCzechoslovakiaDenmarkDominicaDominican RepublicEastern AfricaEastern AsiaEastern EuropeEcuadorEgyptEl SalvadorEnglandEritreaEthiopiaEuropeFijiFranceGhanaGreeceGrenadaGuatemalaGuyanaHaitiHondurasHong KongHungaryIndiaIndonesiaIranIraqIrelandIsraelItalyJamaicaJapanJordanKazakhstanKenyaKoreaKuwaitLaosLatin AmericaLatviaLebanonLiberiaLithuaniaMalaysiaMexicoMicronesiaMiddle AfricaMoldovaMoroccoNepalNetherlandsNicaraguaNigeriaNorth AmericaNorth MacedoniaNorthern AfricaNorthern EuropeNorwayOceaniaPakistanPanamaPeruPhilippinesPolandPortugalRomaniaRussiaSaudi ArabiaScotlandSenegalSerbiaSierra LeoneSingaporeSomaliaSouth AfricaSouth AmericaSouth Central AsiaSouth Eastern AsiaSouthern EuropeSpainSri LankaSt. Vincent and the GrenadinesSudanSwedenSwitzerlandSyriaTaiwanThailandTrinidad and TobagoTurkeyUgandaUkraineUruguayUzbekistanVenezuelaVietnamWest IndiesWestern AfricaWestern AsiaWestern EuropeYemenZaireZimbabweAzores
Family Households with Children
Income
Poverty
Unemployment
Labor Participation
Family Structure
Vehicle Availability
Education Level
Disability

Family Households with Children Comparison

Immigrants from Germany

Soviet Union

Tragic
Tragic
27.0%
FAMILY HOUSEHOLDS WITH CHILDREN
4.4/ 100
METRIC RATING
234th/ 347
METRIC RANK
24.8%
FAMILY HOUSEHOLDS WITH CHILDREN
0.0/ 100
METRIC RATING
347th/ 347
METRIC RANK

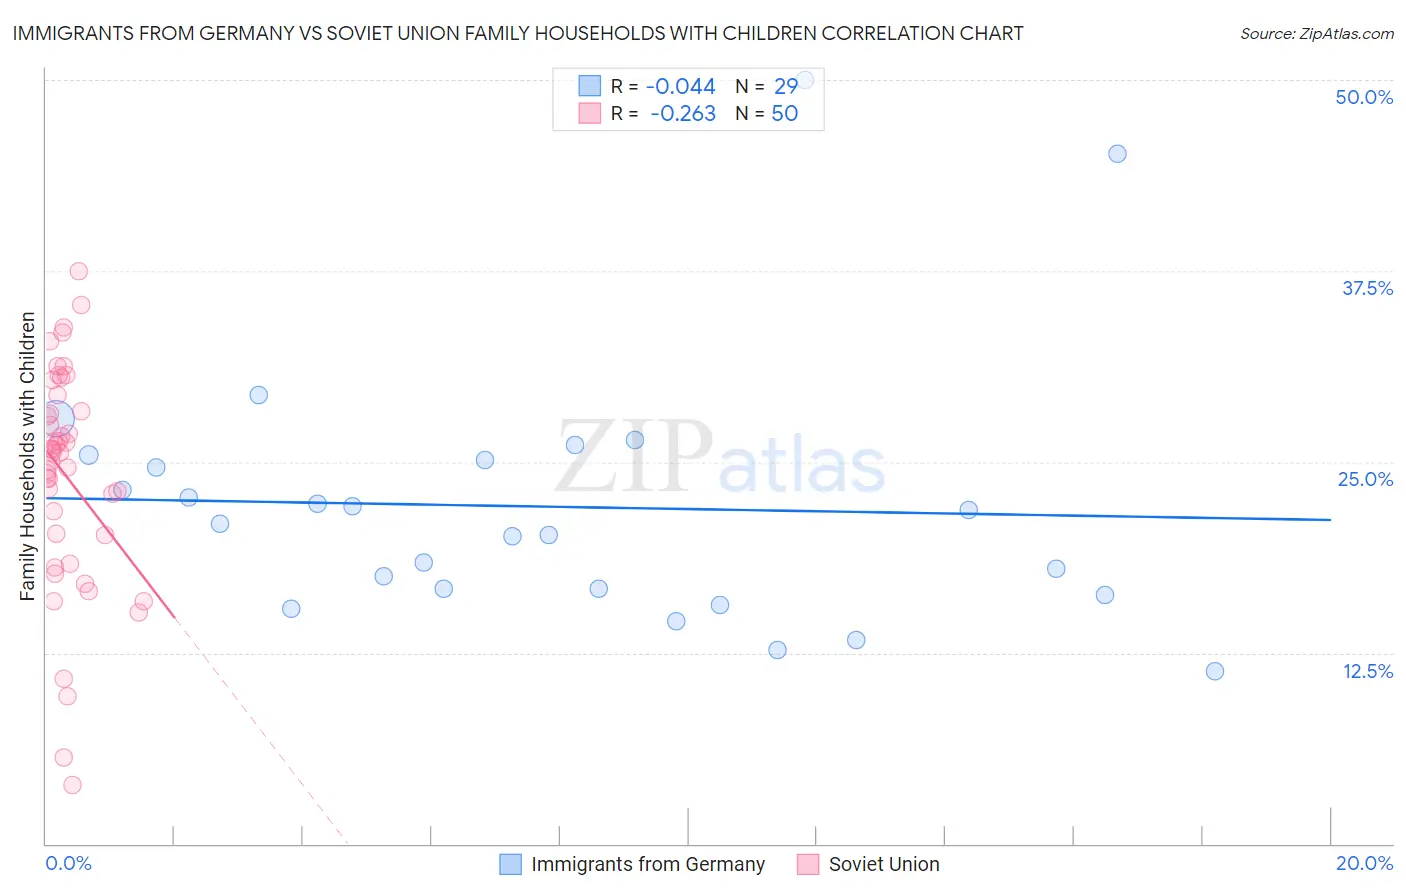
Immigrants from Germany vs Soviet Union Family Households with Children Correlation Chart

The statistical analysis conducted on geographies consisting of 463,563,782 people shows no correlation between the proportion of Immigrants from Germany and percentage of family households with children in the United States with a correlation coefficient (R) of -0.044 and weighted average of 27.0%. Similarly, the statistical analysis conducted on geographies consisting of 43,507,207 people shows a weak negative correlation between the proportion of Soviet Union and percentage of family households with children in the United States with a correlation coefficient (R) of -0.263 and weighted average of 24.8%, a difference of 8.6%.
Immigrants from Germany vs Soviet Union Family Households with Children

Family Households with Children Correlation Summary

MeasurementImmigrants from GermanySoviet Union
Minimum11.3%3.9%
Maximum50.0%37.4%
Range38.7%33.6%
Mean22.1%24.0%
Median21.0%25.6%
Interquartile 25% (IQ1)16.5%20.2%
Interquartile 75% (IQ3)25.3%28.3%
Interquartile Range (IQR)8.8%8.1%
Standard Deviation (Sample)8.5%7.2%
Standard Deviation (Population)8.4%7.2%

Similar Demographics by Family Households with Children

Demographics Similar to Immigrants from Germany by Family Households with Children

In terms of family households with children, the demographic groups most similar to Immigrants from Germany are Immigrants from Morocco (27.0%, a difference of 0.040%), Yugoslavian (27.0%, a difference of 0.080%), Immigrants from Italy (27.0%, a difference of 0.080%), Luxembourger (27.0%, a difference of 0.13%), and Cape Verdean (26.9%, a difference of 0.13%).
DemographicsRating | RankFamily Households with Children
Tsimshian
6.6
/100
|
#227
Tragic
27.0%
Scottish
6.5
/100
|
#228
Tragic
27.0%
Immigrants | Caribbean
6.3
/100
|
#229
Tragic
27.0%
Bulgarians
5.8
/100
|
#230
Tragic
27.0%
Luxembourgers
5.5
/100
|
#231
Tragic
27.0%
Yugoslavians
5.1
/100
|
#232
Tragic
27.0%
Immigrants | Italy
5.0
/100
|
#233
Tragic
27.0%
Immigrants | Germany
4.4
/100
|
#234
Tragic
27.0%
Immigrants | Morocco
4.2
/100
|
#235
Tragic
27.0%
Cape Verdeans
3.6
/100
|
#236
Tragic
26.9%
Immigrants | Netherlands
3.5
/100
|
#237
Tragic
26.9%
Moroccans
3.4
/100
|
#238
Tragic
26.9%
Immigrants | Southern Europe
3.4
/100
|
#239
Tragic
26.9%
Immigrants | Bulgaria
3.3
/100
|
#240
Tragic
26.9%
Navajo
3.2
/100
|
#241
Tragic
26.9%

Demographics Similar to Soviet Union by Family Households with Children

In terms of family households with children, the demographic groups most similar to Soviet Union are Immigrants from Grenada (25.2%, a difference of 1.3%), Carpatho Rusyn (25.2%, a difference of 1.3%), Pueblo (25.2%, a difference of 1.5%), Hopi (25.2%, a difference of 1.6%), and Alsatian (25.3%, a difference of 1.8%).
DemographicsRating | RankFamily Households with Children
Immigrants | Switzerland
0.0
/100
|
#333
Tragic
25.7%
Slovaks
0.0
/100
|
#334
Tragic
25.7%
Immigrants | Croatia
0.0
/100
|
#335
Tragic
25.7%
Immigrants | West Indies
0.0
/100
|
#336
Tragic
25.7%
Puerto Ricans
0.0
/100
|
#337
Tragic
25.6%
Arapaho
0.0
/100
|
#338
Tragic
25.6%
Immigrants | St. Vincent and the Grenadines
0.0
/100
|
#339
Tragic
25.6%
Immigrants | Armenia
0.0
/100
|
#340
Tragic
25.6%
Immigrants | Serbia
0.0
/100
|
#341
Tragic
25.5%
Alsatians
0.0
/100
|
#342
Tragic
25.3%
Hopi
0.0
/100
|
#343
Tragic
25.2%
Pueblo
0.0
/100
|
#344
Tragic
25.2%
Immigrants | Grenada
0.0
/100
|
#345
Tragic
25.2%
Carpatho Rusyns
0.0
/100
|
#346
Tragic
25.2%
Soviet Union
0.0
/100
|
#347
Tragic
24.8%