Immigrants from Ethiopia vs Ugandan Divorced or Separated
COMPARE
Immigrants from Ethiopia
Ugandan
Divorced or Separated
Divorced or Separated Comparison
Immigrants from Ethiopia
Ugandans
12.1%
DIVORCED OR SEPARATED
43.1/ 100
METRIC RATING
182nd/ 347
METRIC RANK
11.8%
DIVORCED OR SEPARATED
93.1/ 100
METRIC RATING
124th/ 347
METRIC RANK
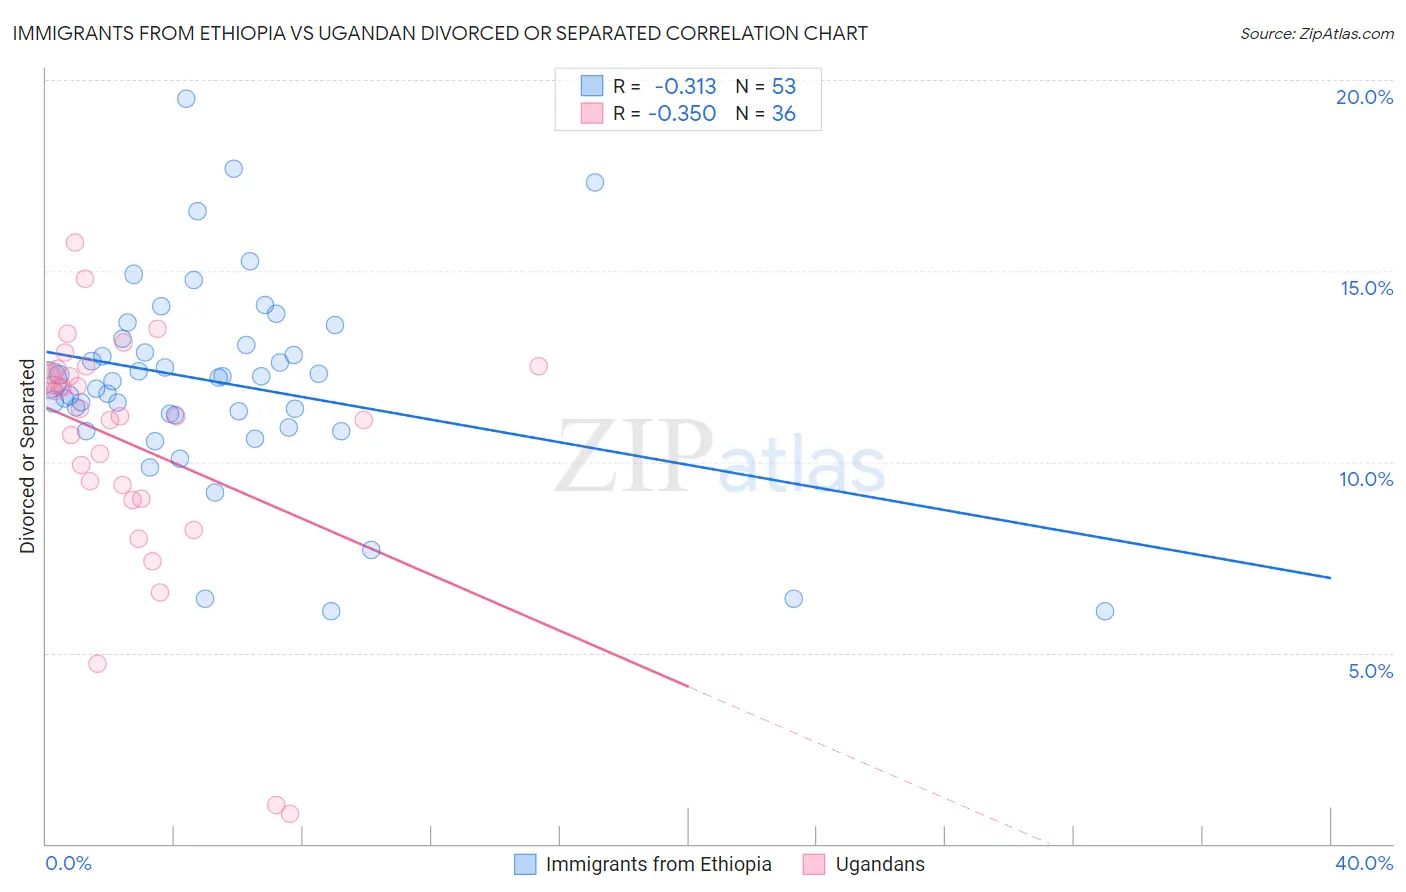
Immigrants from Ethiopia vs Ugandan Divorced or Separated Correlation Chart
The statistical analysis conducted on geographies consisting of 211,499,427 people shows a mild negative correlation between the proportion of Immigrants from Ethiopia and percentage of population currently divorced or separated in the United States with a correlation coefficient (R) of -0.313 and weighted average of 12.1%. Similarly, the statistical analysis conducted on geographies consisting of 94,013,976 people shows a mild negative correlation between the proportion of Ugandans and percentage of population currently divorced or separated in the United States with a correlation coefficient (R) of -0.350 and weighted average of 11.8%, a difference of 2.6%.
Divorced or Separated Correlation Summary
| Measurement | Immigrants from Ethiopia | Ugandan |
| Minimum | 6.1% | 0.80% |
| Maximum | 19.5% | 15.7% |
| Range | 13.4% | 14.9% |
| Mean | 12.1% | 10.5% |
| Median | 12.1% | 11.3% |
| Interquartile 25% (IQ1) | 11.1% | 9.2% |
| Interquartile 75% (IQ3) | 13.2% | 12.4% |
| Interquartile Range (IQR) | 2.1% | 3.1% |
| Standard Deviation (Sample) | 2.7% | 3.3% |
| Standard Deviation (Population) | 2.6% | 3.2% |
Similar Demographics by Divorced or Separated
Demographics Similar to Immigrants from Ethiopia by Divorced or Separated
In terms of divorced or separated, the demographic groups most similar to Immigrants from Ethiopia are Immigrants from Central America (12.1%, a difference of 0.010%), Immigrants from Canada (12.1%, a difference of 0.030%), Barbadian (12.1%, a difference of 0.070%), Immigrants from North America (12.1%, a difference of 0.070%), and Immigrants from Western Europe (12.1%, a difference of 0.090%).
| Demographics | Rating | Rank | Divorced or Separated |
| Immigrants | Sierra Leone | 50.0 /100 | #175 | Average 12.1% |
| Pennsylvania Germans | 48.9 /100 | #176 | Average 12.1% |
| Brazilians | 47.7 /100 | #177 | Average 12.1% |
| Ghanaians | 45.9 /100 | #178 | Average 12.1% |
| Immigrants | Western Europe | 45.6 /100 | #179 | Average 12.1% |
| Barbadians | 45.0 /100 | #180 | Average 12.1% |
| Immigrants | Canada | 44.0 /100 | #181 | Average 12.1% |
| Immigrants | Ethiopia | 43.1 /100 | #182 | Average 12.1% |
| Immigrants | Central America | 42.9 /100 | #183 | Average 12.1% |
| Immigrants | North America | 41.1 /100 | #184 | Average 12.1% |
| Immigrants | Nigeria | 40.5 /100 | #185 | Average 12.1% |
| Immigrants | Chile | 39.0 /100 | #186 | Fair 12.1% |
| Belizeans | 37.7 /100 | #187 | Fair 12.1% |
| Immigrants | Belize | 37.6 /100 | #188 | Fair 12.1% |
| Sierra Leoneans | 35.5 /100 | #189 | Fair 12.1% |
Demographics Similar to Ugandans by Divorced or Separated
In terms of divorced or separated, the demographic groups most similar to Ugandans are Immigrants (11.8%, a difference of 0.080%), Menominee (11.8%, a difference of 0.090%), Ukrainian (11.8%, a difference of 0.11%), South American Indian (11.8%, a difference of 0.13%), and Romanian (11.8%, a difference of 0.21%).
| Demographics | Rating | Rank | Divorced or Separated |
| Immigrants | Uganda | 95.3 /100 | #117 | Exceptional 11.7% |
| Ecuadorians | 95.3 /100 | #118 | Exceptional 11.7% |
| Syrians | 95.1 /100 | #119 | Exceptional 11.7% |
| Iraqis | 94.6 /100 | #120 | Exceptional 11.8% |
| Romanians | 94.5 /100 | #121 | Exceptional 11.8% |
| Menominee | 93.8 /100 | #122 | Exceptional 11.8% |
| Immigrants | Immigrants | 93.7 /100 | #123 | Exceptional 11.8% |
| Ugandans | 93.1 /100 | #124 | Exceptional 11.8% |
| Ukrainians | 92.3 /100 | #125 | Exceptional 11.8% |
| South American Indians | 92.1 /100 | #126 | Exceptional 11.8% |
| South Africans | 88.9 /100 | #127 | Excellent 11.8% |
| Immigrants | Ecuador | 88.9 /100 | #128 | Excellent 11.8% |
| Immigrants | St. Vincent and the Grenadines | 88.4 /100 | #129 | Excellent 11.8% |
| Immigrants | Austria | 88.2 /100 | #130 | Excellent 11.8% |
| Immigrants | Cambodia | 88.2 /100 | #131 | Excellent 11.8% |