Immigrants from Chile vs Turkish Family Households
COMPARE
Immigrants from Chile
Turkish
Family Households
Family Households Comparison
Immigrants from Chile
Turks
64.6%
FAMILY HOUSEHOLDS
76.5/ 100
METRIC RATING
147th/ 347
METRIC RANK
63.6%
FAMILY HOUSEHOLDS
4.5/ 100
METRIC RATING
224th/ 347
METRIC RANK
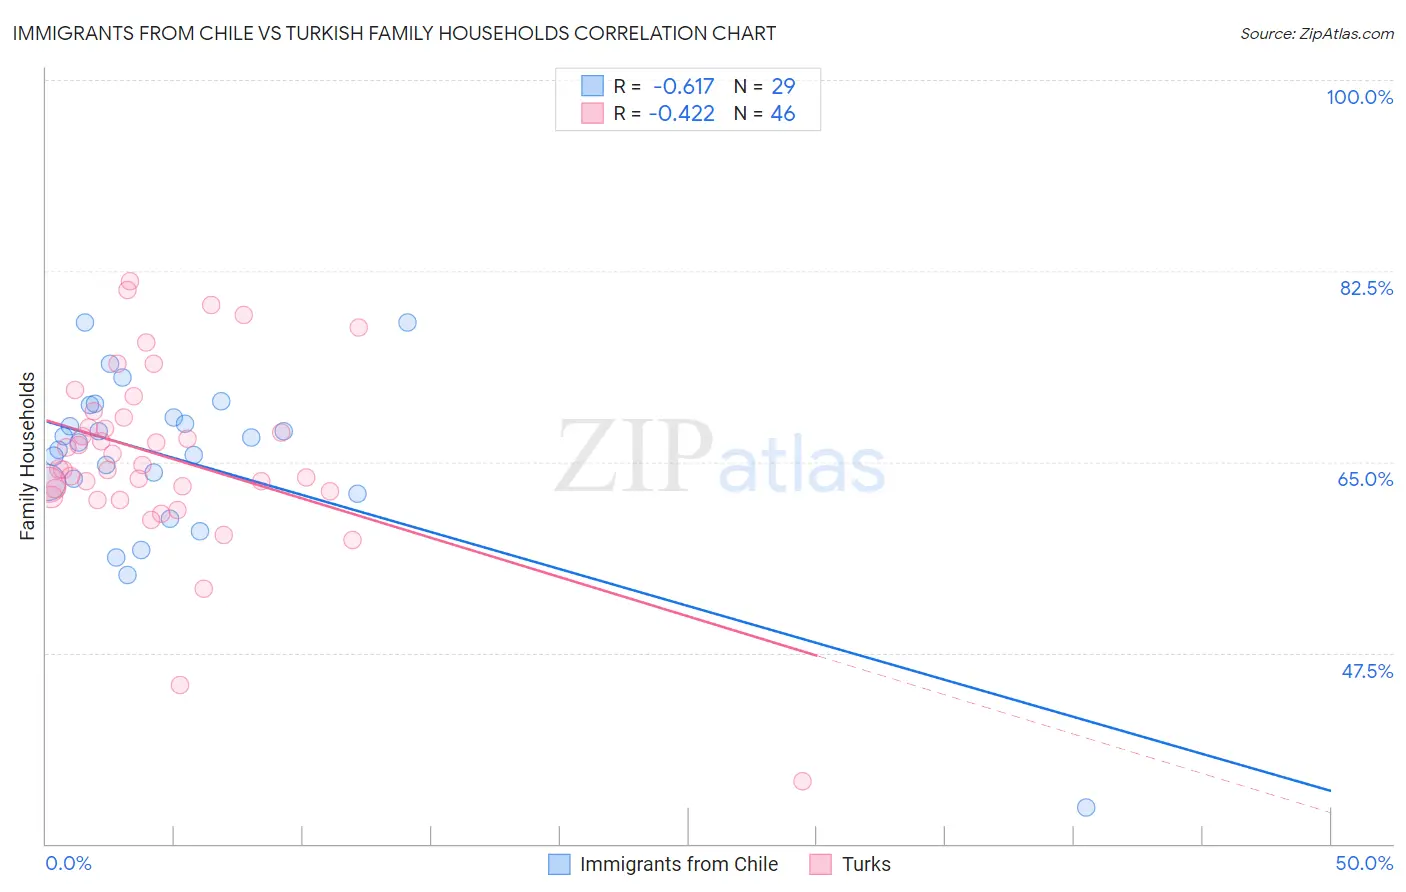
Immigrants from Chile vs Turkish Family Households Correlation Chart
The statistical analysis conducted on geographies consisting of 218,601,267 people shows a significant negative correlation between the proportion of Immigrants from Chile and percentage of family households in the United States with a correlation coefficient (R) of -0.617 and weighted average of 64.6%. Similarly, the statistical analysis conducted on geographies consisting of 271,710,288 people shows a moderate negative correlation between the proportion of Turks and percentage of family households in the United States with a correlation coefficient (R) of -0.422 and weighted average of 63.6%, a difference of 1.4%.
Family Households Correlation Summary
| Measurement | Immigrants from Chile | Turkish |
| Minimum | 33.3% | 35.7% |
| Maximum | 77.8% | 81.5% |
| Range | 44.5% | 45.8% |
| Mean | 65.2% | 65.5% |
| Median | 66.8% | 64.5% |
| Interquartile 25% (IQ1) | 62.6% | 62.3% |
| Interquartile 75% (IQ3) | 69.7% | 69.1% |
| Interquartile Range (IQR) | 7.0% | 6.8% |
| Standard Deviation (Sample) | 8.4% | 8.4% |
| Standard Deviation (Population) | 8.2% | 8.3% |
Similar Demographics by Family Households
Demographics Similar to Immigrants from Chile by Family Households
In terms of family households, the demographic groups most similar to Immigrants from Chile are Delaware (64.6%, a difference of 0.0%), Sioux (64.6%, a difference of 0.0%), Immigrants from Romania (64.6%, a difference of 0.010%), Romanian (64.5%, a difference of 0.020%), and Syrian (64.5%, a difference of 0.020%).
| Demographics | Rating | Rank | Family Households |
| Immigrants | North Macedonia | 84.9 /100 | #140 | Excellent 64.7% |
| Immigrants | Cameroon | 84.8 /100 | #141 | Excellent 64.7% |
| Pakistanis | 84.0 /100 | #142 | Excellent 64.7% |
| Czechoslovakians | 82.1 /100 | #143 | Excellent 64.6% |
| South American Indians | 81.9 /100 | #144 | Excellent 64.6% |
| Welsh | 80.1 /100 | #145 | Excellent 64.6% |
| Immigrants | Romania | 77.0 /100 | #146 | Good 64.6% |
| Immigrants | Chile | 76.5 /100 | #147 | Good 64.6% |
| Delaware | 76.3 /100 | #148 | Good 64.6% |
| Sioux | 76.3 /100 | #149 | Good 64.6% |
| Romanians | 75.3 /100 | #150 | Good 64.5% |
| Syrians | 75.2 /100 | #151 | Good 64.5% |
| Scottish | 70.9 /100 | #152 | Good 64.5% |
| Swedes | 69.8 /100 | #153 | Good 64.5% |
| Austrians | 68.5 /100 | #154 | Good 64.5% |
Demographics Similar to Turks by Family Households
In terms of family households, the demographic groups most similar to Turks are Immigrants from Hungary (63.6%, a difference of 0.010%), Immigrants from Bahamas (63.6%, a difference of 0.020%), Trinidadian and Tobagonian (63.6%, a difference of 0.030%), Immigrants from Belarus (63.7%, a difference of 0.070%), and French Canadian (63.7%, a difference of 0.070%).
| Demographics | Rating | Rank | Family Households |
| Osage | 7.0 /100 | #217 | Tragic 63.7% |
| Marshallese | 6.9 /100 | #218 | Tragic 63.7% |
| Macedonians | 6.5 /100 | #219 | Tragic 63.7% |
| Immigrants | Europe | 6.4 /100 | #220 | Tragic 63.7% |
| Immigrants | South Africa | 5.9 /100 | #221 | Tragic 63.7% |
| Immigrants | Belarus | 5.5 /100 | #222 | Tragic 63.7% |
| French Canadians | 5.4 /100 | #223 | Tragic 63.7% |
| Turks | 4.5 /100 | #224 | Tragic 63.6% |
| Immigrants | Hungary | 4.3 /100 | #225 | Tragic 63.6% |
| Immigrants | Bahamas | 4.2 /100 | #226 | Tragic 63.6% |
| Trinidadians and Tobagonians | 4.1 /100 | #227 | Tragic 63.6% |
| Blackfeet | 3.6 /100 | #228 | Tragic 63.6% |
| Bulgarians | 3.4 /100 | #229 | Tragic 63.6% |
| Immigrants | Brazil | 3.0 /100 | #230 | Tragic 63.6% |
| Immigrants | Greece | 2.9 /100 | #231 | Tragic 63.5% |