Immigrants from Caribbean vs Menominee Average Family Size
COMPARE
Immigrants from Caribbean
Menominee
Average Family Size
Average Family Size Comparison
Immigrants from Caribbean
Menominee
3.33
AVERAGE FAMILY SIZE
99.9/ 100
METRIC RATING
72nd/ 347
METRIC RANK
3.30
AVERAGE FAMILY SIZE
99.4/ 100
METRIC RATING
90th/ 347
METRIC RANK
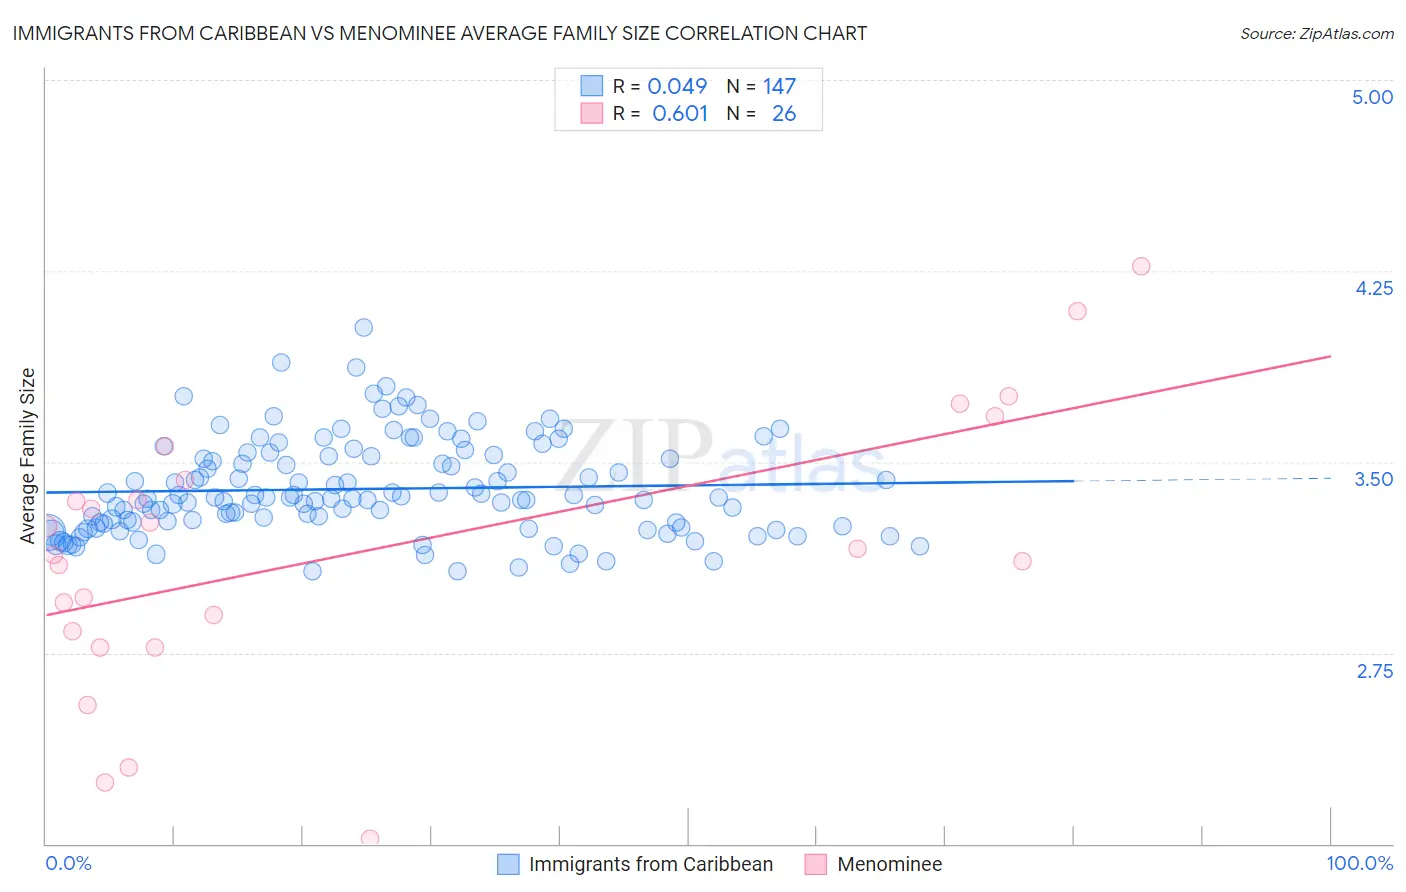
Immigrants from Caribbean vs Menominee Average Family Size Correlation Chart
The statistical analysis conducted on geographies consisting of 449,692,212 people shows no correlation between the proportion of Immigrants from Caribbean and average family size in the United States with a correlation coefficient (R) of 0.049 and weighted average of 3.33. Similarly, the statistical analysis conducted on geographies consisting of 45,777,849 people shows a significant positive correlation between the proportion of Menominee and average family size in the United States with a correlation coefficient (R) of 0.601 and weighted average of 3.30, a difference of 0.64%.
Average Family Size Correlation Summary
| Measurement | Immigrants from Caribbean | Menominee |
| Minimum | 3.07 | 2.02 |
| Maximum | 4.03 | 4.27 |
| Range | 0.96 | 2.25 |
| Mean | 3.39 | 3.15 |
| Median | 3.36 | 3.15 |
| Interquartile 25% (IQ1) | 3.26 | 2.83 |
| Interquartile 75% (IQ3) | 3.52 | 3.43 |
| Interquartile Range (IQR) | 0.27 | 0.60 |
| Standard Deviation (Sample) | 0.19 | 0.54 |
| Standard Deviation (Population) | 0.19 | 0.53 |
Demographics Similar to Immigrants from Caribbean and Menominee by Average Family Size
In terms of average family size, the demographic groups most similar to Immigrants from Caribbean are Yaqui (3.32, a difference of 0.030%), Immigrants from Sierra Leone (3.32, a difference of 0.050%), Immigrants from West Indies (3.33, a difference of 0.070%), Immigrants from Barbados (3.32, a difference of 0.090%), and Trinidadian and Tobagonian (3.32, a difference of 0.11%). Similarly, the demographic groups most similar to Menominee are Malaysian (3.31, a difference of 0.11%), Immigrants from Bolivia (3.31, a difference of 0.12%), Immigrants from Pakistan (3.30, a difference of 0.15%), Immigrants from Peru (3.31, a difference of 0.21%), and Jamaican (3.31, a difference of 0.26%).
| Demographics | Rating | Rank | Average Family Size |
| Immigrants | West Indies | 99.9 /100 | #71 | Exceptional 3.33 |
| Immigrants | Caribbean | 99.9 /100 | #72 | Exceptional 3.33 |
| Yaqui | 99.9 /100 | #73 | Exceptional 3.32 |
| Immigrants | Sierra Leone | 99.9 /100 | #74 | Exceptional 3.32 |
| Immigrants | Barbados | 99.8 /100 | #75 | Exceptional 3.32 |
| Trinidadians and Tobagonians | 99.8 /100 | #76 | Exceptional 3.32 |
| Immigrants | Ecuador | 99.8 /100 | #77 | Exceptional 3.32 |
| Immigrants | Micronesia | 99.8 /100 | #78 | Exceptional 3.32 |
| British West Indians | 99.8 /100 | #79 | Exceptional 3.32 |
| Lumbee | 99.8 /100 | #80 | Exceptional 3.32 |
| Immigrants | Dominica | 99.8 /100 | #81 | Exceptional 3.32 |
| Ecuadorians | 99.8 /100 | #82 | Exceptional 3.32 |
| Immigrants | Afghanistan | 99.8 /100 | #83 | Exceptional 3.32 |
| Immigrants | Nigeria | 99.7 /100 | #84 | Exceptional 3.32 |
| Afghans | 99.7 /100 | #85 | Exceptional 3.31 |
| Jamaicans | 99.7 /100 | #86 | Exceptional 3.31 |
| Immigrants | Peru | 99.7 /100 | #87 | Exceptional 3.31 |
| Immigrants | Bolivia | 99.6 /100 | #88 | Exceptional 3.31 |
| Malaysians | 99.6 /100 | #89 | Exceptional 3.31 |
| Menominee | 99.4 /100 | #90 | Exceptional 3.30 |
| Immigrants | Pakistan | 99.2 /100 | #91 | Exceptional 3.30 |