Immigrants from Cameroon vs Navajo Currently Married
COMPARE
Immigrants from Cameroon
Navajo
Currently Married
Currently Married Comparison
Immigrants from Cameroon
Navajo
44.2%
CURRENTLY MARRIED
0.3/ 100
METRIC RATING
249th/ 347
METRIC RANK
39.0%
CURRENTLY MARRIED
0.0/ 100
METRIC RATING
341st/ 347
METRIC RANK
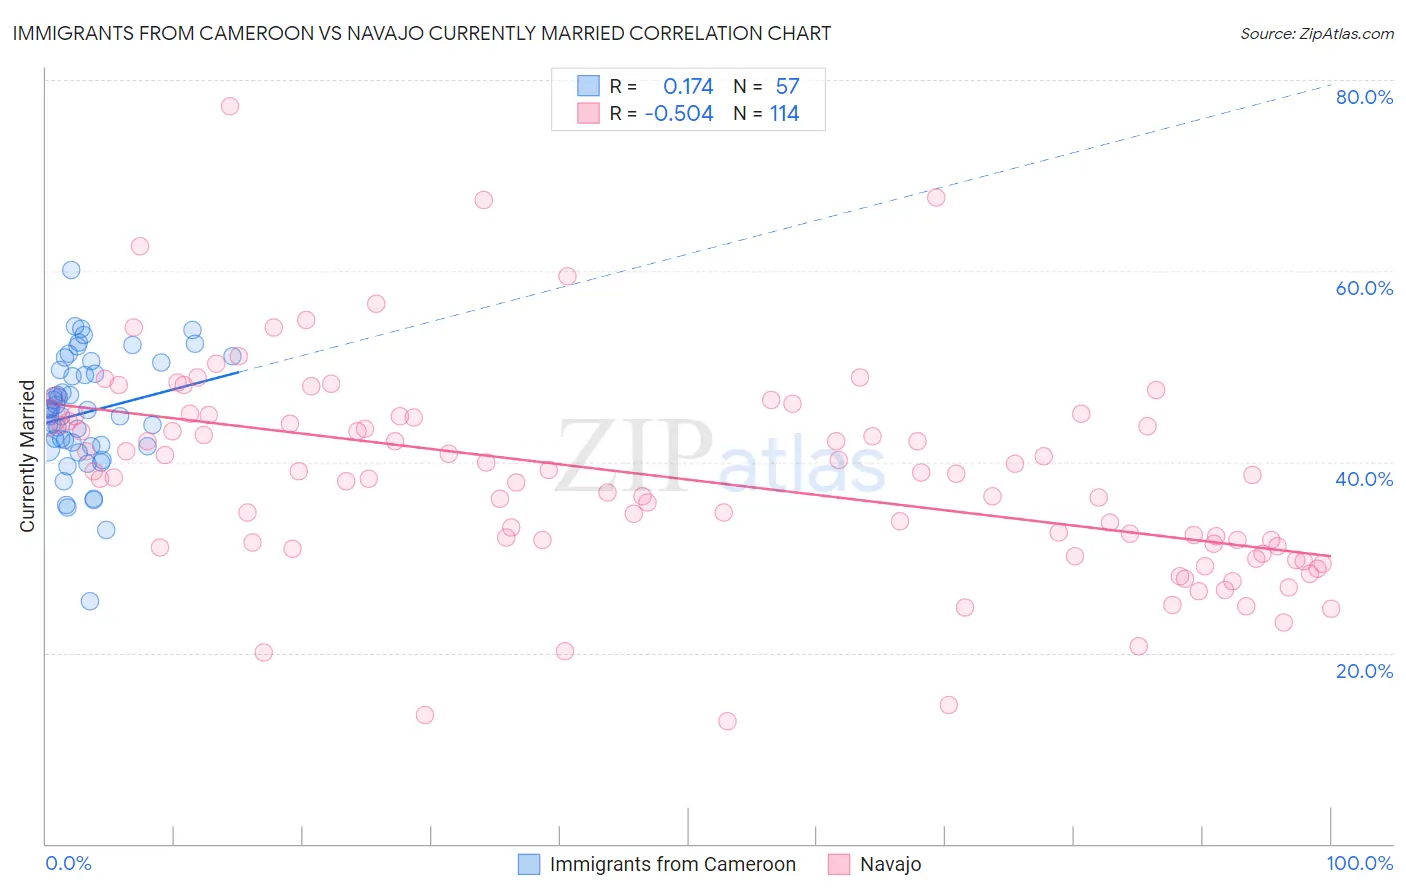
Immigrants from Cameroon vs Navajo Currently Married Correlation Chart
The statistical analysis conducted on geographies consisting of 130,755,125 people shows a poor positive correlation between the proportion of Immigrants from Cameroon and percentage of population currently married in the United States with a correlation coefficient (R) of 0.174 and weighted average of 44.2%. Similarly, the statistical analysis conducted on geographies consisting of 224,862,150 people shows a substantial negative correlation between the proportion of Navajo and percentage of population currently married in the United States with a correlation coefficient (R) of -0.504 and weighted average of 39.0%, a difference of 13.3%.
Currently Married Correlation Summary
| Measurement | Immigrants from Cameroon | Navajo |
| Minimum | 25.4% | 12.8% |
| Maximum | 60.1% | 77.3% |
| Range | 34.7% | 64.5% |
| Mean | 45.2% | 38.4% |
| Median | 45.4% | 38.7% |
| Interquartile 25% (IQ1) | 41.7% | 31.1% |
| Interquartile 75% (IQ3) | 50.0% | 44.6% |
| Interquartile Range (IQR) | 8.3% | 13.5% |
| Standard Deviation (Sample) | 6.2% | 10.9% |
| Standard Deviation (Population) | 6.1% | 10.8% |
Similar Demographics by Currently Married
Demographics Similar to Immigrants from Cameroon by Currently Married
In terms of currently married, the demographic groups most similar to Immigrants from Cameroon are Nicaraguan (44.2%, a difference of 0.020%), Immigrants from Eastern Africa (44.2%, a difference of 0.020%), Blackfeet (44.2%, a difference of 0.080%), Ugandan (44.2%, a difference of 0.10%), and Hispanic or Latino (44.1%, a difference of 0.11%).
| Demographics | Rating | Rank | Currently Married |
| Immigrants | Cambodia | 0.7 /100 | #242 | Tragic 44.5% |
| Immigrants | Ethiopia | 0.7 /100 | #243 | Tragic 44.5% |
| Japanese | 0.6 /100 | #244 | Tragic 44.5% |
| Immigrants | Armenia | 0.4 /100 | #245 | Tragic 44.3% |
| Immigrants | Burma/Myanmar | 0.4 /100 | #246 | Tragic 44.3% |
| Ugandans | 0.4 /100 | #247 | Tragic 44.2% |
| Nicaraguans | 0.3 /100 | #248 | Tragic 44.2% |
| Immigrants | Cameroon | 0.3 /100 | #249 | Tragic 44.2% |
| Immigrants | Eastern Africa | 0.3 /100 | #250 | Tragic 44.2% |
| Blackfeet | 0.3 /100 | #251 | Tragic 44.2% |
| Hispanics or Latinos | 0.3 /100 | #252 | Tragic 44.1% |
| Immigrants | Central America | 0.3 /100 | #253 | Tragic 44.1% |
| Vietnamese | 0.2 /100 | #254 | Tragic 44.0% |
| Yakama | 0.2 /100 | #255 | Tragic 44.0% |
| Shoshone | 0.2 /100 | #256 | Tragic 44.0% |
Demographics Similar to Navajo by Currently Married
In terms of currently married, the demographic groups most similar to Navajo are Immigrants from Dominican Republic (38.9%, a difference of 0.17%), Immigrants from Grenada (39.1%, a difference of 0.35%), Dominican (39.5%, a difference of 1.3%), Cape Verdean (39.6%, a difference of 1.5%), and Black/African American (39.6%, a difference of 1.6%).
| Demographics | Rating | Rank | Currently Married |
| Yup'ik | 0.0 /100 | #333 | Tragic 39.9% |
| Puerto Ricans | 0.0 /100 | #334 | Tragic 39.9% |
| Lumbee | 0.0 /100 | #335 | Tragic 39.8% |
| British West Indians | 0.0 /100 | #336 | Tragic 39.8% |
| Blacks/African Americans | 0.0 /100 | #337 | Tragic 39.6% |
| Cape Verdeans | 0.0 /100 | #338 | Tragic 39.6% |
| Dominicans | 0.0 /100 | #339 | Tragic 39.5% |
| Immigrants | Grenada | 0.0 /100 | #340 | Tragic 39.1% |
| Navajo | 0.0 /100 | #341 | Tragic 39.0% |
| Immigrants | Dominican Republic | 0.0 /100 | #342 | Tragic 38.9% |
| Pueblo | 0.0 /100 | #343 | Tragic 38.2% |
| Immigrants | Cabo Verde | 0.0 /100 | #344 | Tragic 37.8% |
| Tohono O'odham | 0.0 /100 | #345 | Tragic 36.8% |
| Hopi | 0.0 /100 | #346 | Tragic 36.5% |
| Pima | 0.0 /100 | #347 | Tragic 35.9% |