Immigrants from Brazil vs Immigrants from Spain Divorced or Separated

COMPARE

Immigrants from Brazil
Race
Ancestry
AfghanAfricanAlaska NativeAlaskan AthabascanAlbanianAleutAlsatianAmericanApacheArabArapahoArgentineanArmenianAssyrian/Chaldean/SyriacAustralianAustrianBahamianBangladeshiBarbadianBasqueBelgianBelizeanBermudanBhutaneseBlackfeetBolivianBrazilianBritishBritish West IndianBulgarianBurmeseCajunCambodianCanadianCape VerdeanCarpatho RusynCelticCentral AmericanCentral American IndianCherokeeCheyenneChickasawChileanChineseChippewaChoctawColombianColvilleComancheCosta RicanCreeCreekCroatianCrowCubanCypriotCzechCzechoslovakianDanishDelawareDominicanDutchDutch West IndianEastern EuropeanEcuadorianEgyptianEnglishEstonianEthiopianEuropeanFijianFilipinoFinnishFrenchFrench American IndianFrench CanadianGermanGerman RussianGhanaianGreekGuamanian/ChamorroGuatemalanGuyaneseHaitianHmongHonduranHopiHoumaHungarianIcelanderIndian (Asian)IndonesianInupiatIranianIraqiIrishIroquoisIsraeliItalianJamaicanJapaneseJordanianKenyanKiowaKoreanLaotianLatvianLebaneseLiberianLithuanianLumbeeLuxembourgerMacedonianMalaysianMalteseMarshalleseMenomineeMexicanMexican American IndianMongolianMoroccanNative HawaiianNavajoNepaleseNew ZealanderNicaraguanNigerianNorthern EuropeanNorwegianOkinawanOsageOttawaPaiutePakistaniPalestinianPanamanianParaguayanPennsylvania GermanPeruvianPimaPolishPortuguesePotawatomiPuebloPuerto RicanPuget Sound SalishRomanianRussianSalvadoranSamoanScandinavianScotch-IrishScottishSeminoleSenegaleseSerbianShoshoneSierra LeoneanSiouxSlavicSlovakSloveneSomaliSouth AfricanSouth AmericanSouth American IndianSoviet UnionSpaniardSpanishSpanish AmericanSpanish American IndianSri LankanSubsaharan AfricanSudaneseSwedishSwissSyrianTaiwaneseThaiTlingit-HaidaTohono O'OdhamTonganTrinidadian and TobagonianTsimshianTurkishU.S. Virgin IslanderUgandanUkrainianUruguayanUteVenezuelanVietnameseWelshWest IndianYakamaYaquiYugoslavianYumanYup'ikZimbabwean
Immigration
NonimmigrantsImmigrantsAfghanistanAfricaAlbaniaArgentinaArmeniaAsiaAustraliaAustriaBahamasBangladeshBarbadosBelarusBelgiumBelizeBoliviaBosnia and HerzegovinaBrazilBulgariaBurma/MyanmarCabo VerdeCambodiaCameroonCanadaCaribbeanCentral AmericaChileChinaColombiaCongoCosta RicaCroatiaCubaCzechoslovakiaDenmarkDominicaDominican RepublicEastern AfricaEastern AsiaEastern EuropeEcuadorEgyptEl SalvadorEnglandEritreaEthiopiaEuropeFijiFranceGermanyGhanaGreeceGrenadaGuatemalaGuyanaHaitiHondurasHong KongHungaryIndiaIndonesiaIranIraqIrelandIsraelItalyJamaicaJapanJordanKazakhstanKenyaKoreaKuwaitLaosLatin AmericaLatviaLebanonLiberiaLithuaniaMalaysiaMexicoMicronesiaMiddle AfricaMoldovaMoroccoNepalNetherlandsNicaraguaNigeriaNorth AmericaNorth MacedoniaNorthern AfricaNorthern EuropeNorwayOceaniaPakistanPanamaPeruPhilippinesPolandPortugalRomaniaRussiaSaudi ArabiaScotlandSenegalSerbiaSierra LeoneSingaporeSomaliaSouth AfricaSouth AmericaSouth Central AsiaSouth Eastern AsiaSouthern EuropeSri LankaSt. Vincent and the GrenadinesSudanSwedenSwitzerlandSyriaTaiwanThailandTrinidad and TobagoTurkeyUgandaUkraineUruguayUzbekistanVenezuelaVietnamWest IndiesWestern AfricaWestern AsiaWestern EuropeYemenZaireZimbabweAzores
Immigrants from Spain
Race
Ancestry
AfghanAfricanAlaska NativeAlaskan AthabascanAlbanianAleutAlsatianAmericanApacheArabArapahoArgentineanArmenianAssyrian/Chaldean/SyriacAustralianAustrianBahamianBangladeshiBarbadianBasqueBelgianBelizeanBermudanBhutaneseBlackfeetBolivianBrazilianBritishBritish West IndianBulgarianBurmeseCajunCambodianCanadianCape VerdeanCarpatho RusynCelticCentral AmericanCentral American IndianCherokeeCheyenneChickasawChileanChineseChippewaChoctawColombianColvilleComancheCosta RicanCreeCreekCroatianCrowCubanCypriotCzechCzechoslovakianDanishDelawareDominicanDutchDutch West IndianEastern EuropeanEcuadorianEgyptianEnglishEstonianEthiopianEuropeanFijianFilipinoFinnishFrenchFrench American IndianFrench CanadianGermanGerman RussianGhanaianGreekGuamanian/ChamorroGuatemalanGuyaneseHaitianHmongHonduranHopiHoumaHungarianIcelanderIndian (Asian)IndonesianInupiatIranianIraqiIrishIroquoisIsraeliItalianJamaicanJapaneseJordanianKenyanKiowaKoreanLaotianLatvianLebaneseLiberianLithuanianLumbeeLuxembourgerMacedonianMalaysianMalteseMarshalleseMenomineeMexicanMexican American IndianMongolianMoroccanNative HawaiianNavajoNepaleseNew ZealanderNicaraguanNigerianNorthern EuropeanNorwegianOkinawanOsageOttawaPaiutePakistaniPalestinianPanamanianParaguayanPennsylvania GermanPeruvianPimaPolishPortuguesePotawatomiPuebloPuerto RicanPuget Sound SalishRomanianRussianSalvadoranSamoanScandinavianScotch-IrishScottishSeminoleSenegaleseSerbianShoshoneSierra LeoneanSiouxSlavicSlovakSloveneSomaliSouth AfricanSouth AmericanSouth American IndianSoviet UnionSpaniardSpanishSpanish AmericanSpanish American IndianSri LankanSubsaharan AfricanSudaneseSwedishSwissSyrianTaiwaneseThaiTlingit-HaidaTohono O'OdhamTonganTrinidadian and TobagonianTsimshianTurkishU.S. Virgin IslanderUgandanUkrainianUruguayanUteVenezuelanVietnameseWelshWest IndianYakamaYaquiYugoslavianYumanYup'ikZimbabwean
Immigration
NonimmigrantsImmigrantsAfghanistanAfricaAlbaniaArgentinaArmeniaAsiaAustraliaAustriaBahamasBangladeshBarbadosBelarusBelgiumBelizeBoliviaBosnia and HerzegovinaBulgariaBurma/MyanmarCabo VerdeCambodiaCameroonCanadaCaribbeanCentral AmericaChileChinaColombiaCongoCosta RicaCroatiaCubaCzechoslovakiaDenmarkDominicaDominican RepublicEastern AfricaEastern AsiaEastern EuropeEcuadorEgyptEl SalvadorEnglandEritreaEthiopiaEuropeFijiFranceGermanyGhanaGreeceGrenadaGuatemalaGuyanaHaitiHondurasHong KongHungaryIndiaIndonesiaIranIraqIrelandIsraelItalyJamaicaJapanJordanKazakhstanKenyaKoreaKuwaitLaosLatin AmericaLatviaLebanonLiberiaLithuaniaMalaysiaMexicoMicronesiaMiddle AfricaMoldovaMoroccoNepalNetherlandsNicaraguaNigeriaNorth AmericaNorth MacedoniaNorthern AfricaNorthern EuropeNorwayOceaniaPakistanPanamaPeruPhilippinesPolandPortugalRomaniaRussiaSaudi ArabiaScotlandSenegalSerbiaSierra LeoneSingaporeSomaliaSouth AfricaSouth AmericaSouth Central AsiaSouth Eastern AsiaSouthern EuropeSpainSri LankaSt. Vincent and the GrenadinesSudanSwedenSwitzerlandSyriaTaiwanThailandTrinidad and TobagoTurkeyUgandaUkraineUruguayUzbekistanVenezuelaVietnamWest IndiesWestern AfricaWestern AsiaWestern EuropeYemenZaireZimbabweAzores
Divorced or Separated
Income
Poverty
Unemployment
Labor Participation
Family Structure
Vehicle Availability
Education Level
Disability

Divorced or Separated Comparison

Immigrants from Brazil

Immigrants from Spain

Good
Exceptional
12.0%
DIVORCED OR SEPARATED
68.8/ 100
METRIC RATING
157th/ 347
METRIC RANK
11.7%
DIVORCED OR SEPARATED
96.8/ 100
METRIC RATING
111th/ 347
METRIC RANK

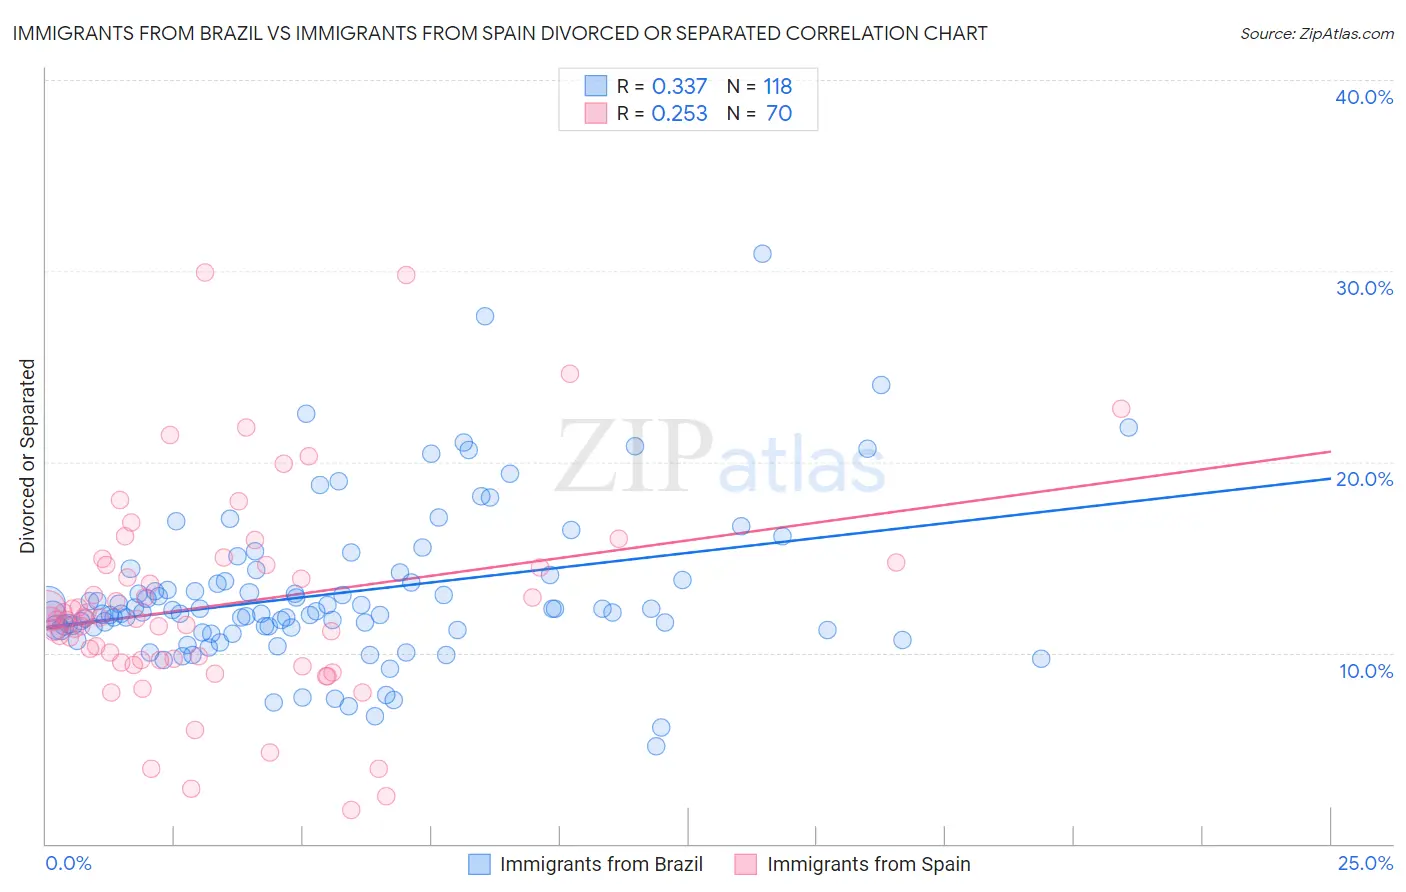
Immigrants from Brazil vs Immigrants from Spain Divorced or Separated Correlation Chart

The statistical analysis conducted on geographies consisting of 342,897,548 people shows a mild positive correlation between the proportion of Immigrants from Brazil and percentage of population currently divorced or separated in the United States with a correlation coefficient (R) of 0.337 and weighted average of 12.0%. Similarly, the statistical analysis conducted on geographies consisting of 239,591,348 people shows a weak positive correlation between the proportion of Immigrants from Spain and percentage of population currently divorced or separated in the United States with a correlation coefficient (R) of 0.253 and weighted average of 11.7%, a difference of 2.3%.
Immigrants from Brazil vs Immigrants from Spain Divorced or Separated

Divorced or Separated Correlation Summary

MeasurementImmigrants from BrazilImmigrants from Spain
Minimum5.1%1.8%
Maximum30.9%29.9%
Range25.8%28.1%
Mean13.1%12.5%
Median12.1%11.8%
Interquartile 25% (IQ1)11.2%9.6%
Interquartile 75% (IQ3)13.8%14.6%
Interquartile Range (IQR)2.6%5.0%
Standard Deviation (Sample)4.1%5.5%
Standard Deviation (Population)4.0%5.4%

Similar Demographics by Divorced or Separated

Demographics Similar to Immigrants from Brazil by Divorced or Separated

In terms of divorced or separated, the demographic groups most similar to Immigrants from Brazil are Hungarian (12.0%, a difference of 0.060%), Japanese (12.0%, a difference of 0.090%), Chilean (12.0%, a difference of 0.10%), Icelander (12.0%, a difference of 0.11%), and Immigrants from Barbados (12.0%, a difference of 0.11%).
DemographicsRating | RankDivorced or Separated
Immigrants | Portugal
77.3
/100
|
#150
Good
11.9%
Czechs
76.4
/100
|
#151
Good
11.9%
Immigrants | Hungary
73.7
/100
|
#152
Good
11.9%
Austrians
72.2
/100
|
#153
Good
12.0%
Chileans
71.3
/100
|
#154
Good
12.0%
Japanese
70.9
/100
|
#155
Good
12.0%
Hungarians
70.3
/100
|
#156
Good
12.0%
Immigrants | Brazil
68.8
/100
|
#157
Good
12.0%
Icelanders
66.0
/100
|
#158
Good
12.0%
Immigrants | Barbados
66.0
/100
|
#159
Good
12.0%
Immigrants | Scotland
65.8
/100
|
#160
Good
12.0%
Marshallese
64.6
/100
|
#161
Good
12.0%
Samoans
64.3
/100
|
#162
Good
12.0%
Navajo
63.9
/100
|
#163
Good
12.0%
Swiss
63.6
/100
|
#164
Good
12.0%

Demographics Similar to Immigrants from Spain by Divorced or Separated

In terms of divorced or separated, the demographic groups most similar to Immigrants from Spain are Immigrants from South Africa (11.7%, a difference of 0.040%), Immigrants from Czechoslovakia (11.7%, a difference of 0.040%), Greek (11.7%, a difference of 0.050%), Immigrants from France (11.7%, a difference of 0.050%), and Estonian (11.7%, a difference of 0.050%).
DemographicsRating | RankDivorced or Separated
Salvadorans
98.2
/100
|
#104
Exceptional
11.6%
Immigrants | El Salvador
97.9
/100
|
#105
Exceptional
11.7%
Immigrants | Kazakhstan
97.8
/100
|
#106
Exceptional
11.7%
Native Hawaiians
97.2
/100
|
#107
Exceptional
11.7%
Greeks
96.9
/100
|
#108
Exceptional
11.7%
Immigrants | South Africa
96.9
/100
|
#109
Exceptional
11.7%
Immigrants | Czechoslovakia
96.9
/100
|
#110
Exceptional
11.7%
Immigrants | Spain
96.8
/100
|
#111
Exceptional
11.7%
Immigrants | France
96.6
/100
|
#112
Exceptional
11.7%
Estonians
96.6
/100
|
#113
Exceptional
11.7%
Immigrants | Norway
95.9
/100
|
#114
Exceptional
11.7%
Lithuanians
95.7
/100
|
#115
Exceptional
11.7%
Immigrants | Iraq
95.4
/100
|
#116
Exceptional
11.7%
Immigrants | Uganda
95.3
/100
|
#117
Exceptional
11.7%
Ecuadorians
95.3
/100
|
#118
Exceptional
11.7%