Immigrants from Brazil vs Hopi Average Family Size
COMPARE
Immigrants from Brazil
Hopi
Average Family Size
Average Family Size Comparison
Immigrants from Brazil
Hopi
3.18
AVERAGE FAMILY SIZE
2.7/ 100
METRIC RATING
245th/ 347
METRIC RANK
3.60
AVERAGE FAMILY SIZE
100.0/ 100
METRIC RATING
9th/ 347
METRIC RANK
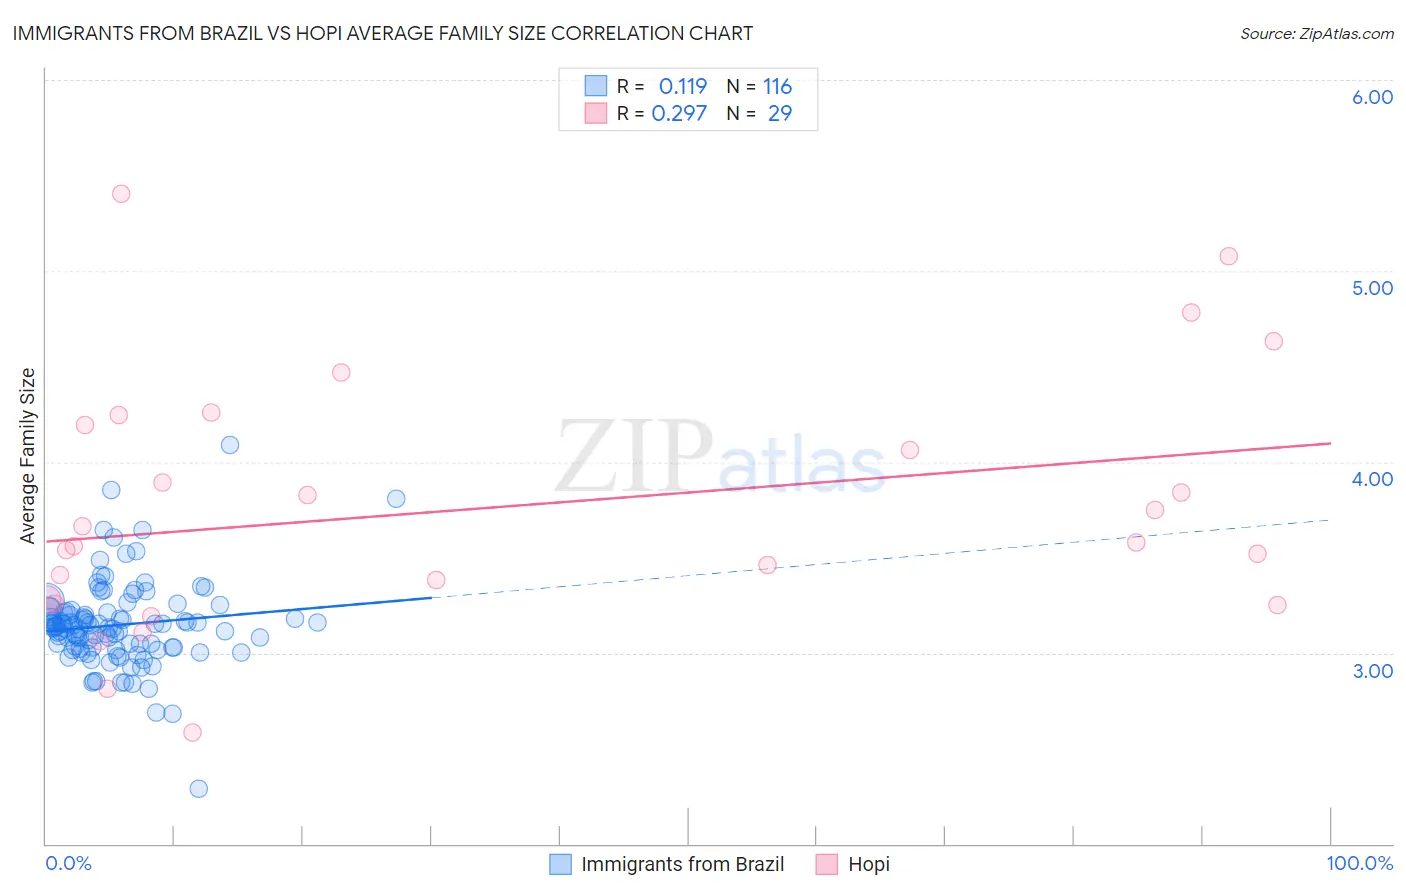
Immigrants from Brazil vs Hopi Average Family Size Correlation Chart
The statistical analysis conducted on geographies consisting of 342,856,280 people shows a poor positive correlation between the proportion of Immigrants from Brazil and average family size in the United States with a correlation coefficient (R) of 0.119 and weighted average of 3.18. Similarly, the statistical analysis conducted on geographies consisting of 74,733,485 people shows a weak positive correlation between the proportion of Hopi and average family size in the United States with a correlation coefficient (R) of 0.297 and weighted average of 3.60, a difference of 13.3%.
Average Family Size Correlation Summary
| Measurement | Immigrants from Brazil | Hopi |
| Minimum | 2.29 | 2.58 |
| Maximum | 4.09 | 5.41 |
| Range | 1.80 | 2.83 |
| Mean | 3.15 | 3.76 |
| Median | 3.14 | 3.58 |
| Interquartile 25% (IQ1) | 3.03 | 3.27 |
| Interquartile 75% (IQ3) | 3.21 | 4.22 |
| Interquartile Range (IQR) | 0.18 | 0.95 |
| Standard Deviation (Sample) | 0.23 | 0.67 |
| Standard Deviation (Population) | 0.23 | 0.65 |
Similar Demographics by Average Family Size
Demographics Similar to Immigrants from Brazil by Average Family Size
In terms of average family size, the demographic groups most similar to Immigrants from Brazil are Immigrants from Southern Europe (3.18, a difference of 0.030%), Hungarian (3.18, a difference of 0.040%), Immigrants from Moldova (3.18, a difference of 0.040%), Danish (3.17, a difference of 0.040%), and Cajun (3.17, a difference of 0.050%).
| Demographics | Rating | Rank | Average Family Size |
| Romanians | 3.7 /100 | #238 | Tragic 3.18 |
| Houma | 3.4 /100 | #239 | Tragic 3.18 |
| Osage | 3.2 /100 | #240 | Tragic 3.18 |
| Immigrants | Japan | 3.0 /100 | #241 | Tragic 3.18 |
| Hungarians | 3.0 /100 | #242 | Tragic 3.18 |
| Immigrants | Moldova | 2.9 /100 | #243 | Tragic 3.18 |
| Immigrants | Southern Europe | 2.9 /100 | #244 | Tragic 3.18 |
| Immigrants | Brazil | 2.7 /100 | #245 | Tragic 3.18 |
| Danes | 2.5 /100 | #246 | Tragic 3.17 |
| Cajuns | 2.4 /100 | #247 | Tragic 3.17 |
| Immigrants | Belarus | 2.3 /100 | #248 | Tragic 3.17 |
| Immigrants | Eastern Europe | 2.1 /100 | #249 | Tragic 3.17 |
| Puget Sound Salish | 1.9 /100 | #250 | Tragic 3.17 |
| Immigrants | Spain | 1.8 /100 | #251 | Tragic 3.17 |
| Immigrants | Saudi Arabia | 1.7 /100 | #252 | Tragic 3.17 |
Demographics Similar to Hopi by Average Family Size
In terms of average family size, the demographic groups most similar to Hopi are Immigrants from Yemen (3.60, a difference of 0.010%), Spanish American Indian (3.58, a difference of 0.35%), Inupiat (3.63, a difference of 0.87%), Arapaho (3.64, a difference of 1.1%), and Navajo (3.65, a difference of 1.4%).
| Demographics | Rating | Rank | Average Family Size |
| Crow | 100 /100 | #2 | Exceptional 3.82 |
| Pueblo | 100 /100 | #3 | Exceptional 3.79 |
| Pima | 100 /100 | #4 | Exceptional 3.75 |
| Navajo | 100.0 /100 | #5 | Exceptional 3.65 |
| Arapaho | 100.0 /100 | #6 | Exceptional 3.64 |
| Inupiat | 100.0 /100 | #7 | Exceptional 3.63 |
| Immigrants | Yemen | 100.0 /100 | #8 | Exceptional 3.60 |
| Hopi | 100.0 /100 | #9 | Exceptional 3.60 |
| Spanish American Indians | 100.0 /100 | #10 | Exceptional 3.58 |
| Tohono O'odham | 100.0 /100 | #11 | Exceptional 3.53 |
| Immigrants | Mexico | 100.0 /100 | #12 | Exceptional 3.52 |
| Sioux | 100.0 /100 | #13 | Exceptional 3.52 |
| Immigrants | Central America | 100.0 /100 | #14 | Exceptional 3.49 |
| Tongans | 100.0 /100 | #15 | Exceptional 3.49 |
| Ute | 100.0 /100 | #16 | Exceptional 3.49 |