Immigrants from Bosnia and Herzegovina vs Palestinian Births to Unmarried Women
COMPARE
Immigrants from Bosnia and Herzegovina
Palestinian
Births to Unmarried Women
Births to Unmarried Women Comparison
Immigrants from Bosnia and Herzegovina
Palestinians
30.3%
BIRTHS TO UNMARRIED WOMEN
85.7/ 100
METRIC RATING
130th/ 347
METRIC RANK
28.4%
BIRTHS TO UNMARRIED WOMEN
98.7/ 100
METRIC RATING
67th/ 347
METRIC RANK
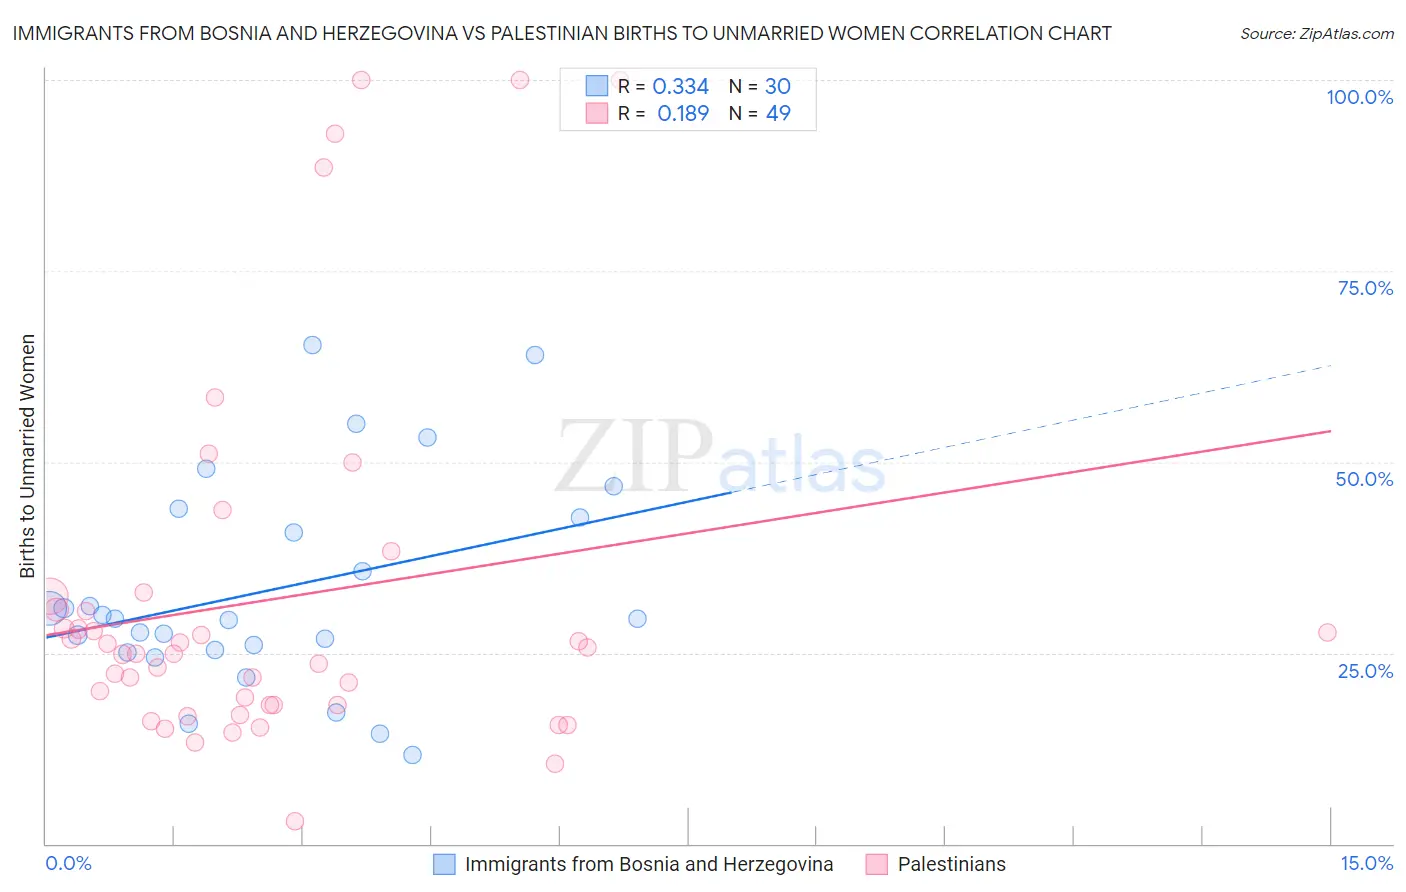
Immigrants from Bosnia and Herzegovina vs Palestinian Births to Unmarried Women Correlation Chart
The statistical analysis conducted on geographies consisting of 151,670,112 people shows a mild positive correlation between the proportion of Immigrants from Bosnia and Herzegovina and percentage of births to unmarried women in the United States with a correlation coefficient (R) of 0.334 and weighted average of 30.3%. Similarly, the statistical analysis conducted on geographies consisting of 207,464,489 people shows a poor positive correlation between the proportion of Palestinians and percentage of births to unmarried women in the United States with a correlation coefficient (R) of 0.189 and weighted average of 28.4%, a difference of 6.7%.
Births to Unmarried Women Correlation Summary
| Measurement | Immigrants from Bosnia and Herzegovina | Palestinian |
| Minimum | 11.7% | 2.9% |
| Maximum | 65.3% | 100.0% |
| Range | 53.6% | 97.1% |
| Mean | 33.3% | 32.1% |
| Median | 29.5% | 24.9% |
| Interquartile 25% (IQ1) | 25.3% | 18.1% |
| Interquartile 75% (IQ3) | 42.7% | 31.6% |
| Interquartile Range (IQR) | 17.4% | 13.5% |
| Standard Deviation (Sample) | 13.8% | 24.2% |
| Standard Deviation (Population) | 13.6% | 23.9% |
Similar Demographics by Births to Unmarried Women
Demographics Similar to Immigrants from Bosnia and Herzegovina by Births to Unmarried Women
In terms of births to unmarried women, the demographic groups most similar to Immigrants from Bosnia and Herzegovina are Immigrants from Spain (30.3%, a difference of 0.010%), Immigrants from Zimbabwe (30.3%, a difference of 0.010%), Icelander (30.3%, a difference of 0.050%), New Zealander (30.3%, a difference of 0.050%), and Immigrants from Morocco (30.4%, a difference of 0.090%).
| Demographics | Rating | Rank | Births to Unmarried Women |
| Syrians | 88.2 /100 | #123 | Excellent 30.2% |
| Croatians | 88.0 /100 | #124 | Excellent 30.2% |
| Vietnamese | 87.7 /100 | #125 | Excellent 30.2% |
| Europeans | 87.2 /100 | #126 | Excellent 30.2% |
| Chinese | 87.1 /100 | #127 | Excellent 30.2% |
| Icelanders | 86.0 /100 | #128 | Excellent 30.3% |
| Immigrants | Spain | 85.8 /100 | #129 | Excellent 30.3% |
| Immigrants | Bosnia and Herzegovina | 85.7 /100 | #130 | Excellent 30.3% |
| Immigrants | Zimbabwe | 85.7 /100 | #131 | Excellent 30.3% |
| New Zealanders | 85.5 /100 | #132 | Excellent 30.3% |
| Immigrants | Morocco | 85.2 /100 | #133 | Excellent 30.4% |
| Immigrants | South Eastern Asia | 85.2 /100 | #134 | Excellent 30.4% |
| Brazilians | 84.8 /100 | #135 | Excellent 30.4% |
| Immigrants | Scotland | 84.6 /100 | #136 | Excellent 30.4% |
| Immigrants | Philippines | 83.9 /100 | #137 | Excellent 30.4% |
Demographics Similar to Palestinians by Births to Unmarried Women
In terms of births to unmarried women, the demographic groups most similar to Palestinians are Immigrants from Europe (28.4%, a difference of 0.050%), Bolivian (28.5%, a difference of 0.090%), Immigrants from Egypt (28.4%, a difference of 0.11%), Immigrants from Czechoslovakia (28.4%, a difference of 0.13%), and Tongan (28.4%, a difference of 0.15%).
| Demographics | Rating | Rank | Births to Unmarried Women |
| Immigrants | Turkey | 99.1 /100 | #60 | Exceptional 28.1% |
| Immigrants | North Macedonia | 99.1 /100 | #61 | Exceptional 28.1% |
| Egyptians | 99.0 /100 | #62 | Exceptional 28.2% |
| Immigrants | Serbia | 98.9 /100 | #63 | Exceptional 28.3% |
| Tongans | 98.8 /100 | #64 | Exceptional 28.4% |
| Immigrants | Czechoslovakia | 98.8 /100 | #65 | Exceptional 28.4% |
| Immigrants | Egypt | 98.8 /100 | #66 | Exceptional 28.4% |
| Palestinians | 98.7 /100 | #67 | Exceptional 28.4% |
| Immigrants | Europe | 98.7 /100 | #68 | Exceptional 28.4% |
| Bolivians | 98.7 /100 | #69 | Exceptional 28.5% |
| Laotians | 98.6 /100 | #70 | Exceptional 28.5% |
| Jordanians | 98.5 /100 | #71 | Exceptional 28.5% |
| Immigrants | Sweden | 98.5 /100 | #72 | Exceptional 28.5% |
| Albanians | 98.5 /100 | #73 | Exceptional 28.5% |
| Immigrants | Bolivia | 98.5 /100 | #74 | Exceptional 28.6% |