Immigrants from Bosnia and Herzegovina vs Delaware Single Mother Households

COMPARE

Immigrants from Bosnia and Herzegovina
Race
Ancestry
AfghanAfricanAlaska NativeAlaskan AthabascanAlbanianAleutAlsatianAmericanApacheArabArapahoArgentineanArmenianAssyrian/Chaldean/SyriacAustralianAustrianBahamianBangladeshiBarbadianBasqueBelgianBelizeanBermudanBhutaneseBlackfeetBolivianBrazilianBritishBritish West IndianBulgarianBurmeseCajunCambodianCanadianCape VerdeanCarpatho RusynCelticCentral AmericanCentral American IndianCherokeeCheyenneChickasawChileanChineseChippewaChoctawColombianColvilleComancheCosta RicanCreeCreekCroatianCrowCubanCypriotCzechCzechoslovakianDanishDominicanDutchDutch West IndianEastern EuropeanEcuadorianEgyptianEnglishEstonianEthiopianEuropeanFijianFilipinoFinnishFrenchFrench American IndianFrench CanadianGermanGerman RussianGhanaianGreekGuamanian/ChamorroGuatemalanGuyaneseHaitianHmongHonduranHopiHoumaHungarianIcelanderIndian (Asian)IndonesianInupiatIranianIraqiIrishIroquoisIsraeliItalianJamaicanJapaneseJordanianKenyanKiowaKoreanLaotianLatvianLebaneseLiberianLithuanianLumbeeLuxembourgerMacedonianMalaysianMalteseMarshalleseMenomineeMexicanMexican American IndianMongolianMoroccanNative HawaiianNavajoNepaleseNew ZealanderNicaraguanNigerianNorthern EuropeanNorwegianOkinawanOsageOttawaPaiutePakistaniPalestinianPanamanianParaguayanPennsylvania GermanPeruvianPimaPolishPortuguesePotawatomiPuebloPuerto RicanPuget Sound SalishRomanianRussianSalvadoranSamoanScandinavianScotch-IrishScottishSeminoleSenegaleseSerbianShoshoneSierra LeoneanSiouxSlavicSlovakSloveneSomaliSouth AfricanSouth AmericanSouth American IndianSoviet UnionSpaniardSpanishSpanish AmericanSpanish American IndianSri LankanSubsaharan AfricanSudaneseSwedishSwissSyrianTaiwaneseThaiTlingit-HaidaTohono O'OdhamTonganTrinidadian and TobagonianTsimshianTurkishU.S. Virgin IslanderUgandanUkrainianUruguayanUteVenezuelanVietnameseWelshWest IndianYakamaYaquiYugoslavianYumanYup'ikZimbabwean
Immigration
NonimmigrantsImmigrantsAfghanistanAfricaAlbaniaArgentinaArmeniaAsiaAustraliaAustriaBahamasBangladeshBarbadosBelarusBelgiumBelizeBoliviaBosnia and HerzegovinaBrazilBulgariaBurma/MyanmarCabo VerdeCambodiaCameroonCanadaCaribbeanCentral AmericaChileChinaColombiaCongoCosta RicaCroatiaCubaCzechoslovakiaDenmarkDominicaDominican RepublicEastern AfricaEastern AsiaEastern EuropeEcuadorEgyptEl SalvadorEnglandEritreaEthiopiaEuropeFijiFranceGermanyGhanaGreeceGrenadaGuatemalaGuyanaHaitiHondurasHong KongHungaryIndiaIndonesiaIranIraqIrelandIsraelItalyJamaicaJapanJordanKazakhstanKenyaKoreaKuwaitLaosLatin AmericaLatviaLebanonLiberiaLithuaniaMalaysiaMexicoMicronesiaMiddle AfricaMoldovaMoroccoNepalNetherlandsNicaraguaNigeriaNorth AmericaNorth MacedoniaNorthern AfricaNorthern EuropeNorwayOceaniaPakistanPanamaPeruPhilippinesPolandPortugalRomaniaRussiaSaudi ArabiaScotlandSenegalSerbiaSierra LeoneSingaporeSomaliaSouth AfricaSouth AmericaSouth Central AsiaSouth Eastern AsiaSouthern EuropeSpainSri LankaSt. Vincent and the GrenadinesSudanSwedenSwitzerlandSyriaTaiwanThailandTrinidad and TobagoTurkeyUgandaUkraineUruguayUzbekistanVenezuelaVietnamWest IndiesWestern AfricaWestern AsiaWestern EuropeYemenZaireZimbabweAzores
Delaware
Race
Ancestry
AfghanAfricanAlaska NativeAlaskan AthabascanAlbanianAleutAlsatianAmericanApacheArabArapahoArgentineanArmenianAssyrian/Chaldean/SyriacAustralianAustrianBahamianBangladeshiBarbadianBasqueBelgianBelizeanBermudanBhutaneseBlackfeetBolivianBrazilianBritishBritish West IndianBulgarianBurmeseCajunCambodianCanadianCape VerdeanCarpatho RusynCelticCentral AmericanCentral American IndianCherokeeCheyenneChickasawChileanChineseChippewaChoctawColombianColvilleComancheCosta RicanCreeCreekCroatianCrowCubanCypriotCzechCzechoslovakianDanishDelawareDominicanDutchDutch West IndianEastern EuropeanEcuadorianEgyptianEnglishEstonianEthiopianEuropeanFijianFilipinoFinnishFrenchFrench American IndianFrench CanadianGermanGerman RussianGhanaianGreekGuamanian/ChamorroGuatemalanGuyaneseHaitianHmongHonduranHopiHoumaHungarianIcelanderIndian (Asian)IndonesianInupiatIranianIraqiIrishIroquoisIsraeliItalianJamaicanJapaneseJordanianKenyanKiowaKoreanLaotianLatvianLebaneseLiberianLithuanianLumbeeLuxembourgerMacedonianMalaysianMalteseMarshalleseMenomineeMexicanMexican American IndianMongolianMoroccanNative HawaiianNavajoNepaleseNew ZealanderNicaraguanNigerianNorthern EuropeanNorwegianOkinawanOsageOttawaPaiutePakistaniPalestinianPanamanianParaguayanPennsylvania GermanPeruvianPimaPolishPortuguesePotawatomiPuebloPuerto RicanPuget Sound SalishRomanianRussianSalvadoranSamoanScandinavianScotch-IrishScottishSeminoleSenegaleseSerbianShoshoneSierra LeoneanSiouxSlavicSlovakSloveneSomaliSouth AfricanSouth AmericanSouth American IndianSoviet UnionSpaniardSpanishSpanish AmericanSpanish American IndianSri LankanSubsaharan AfricanSudaneseSwedishSwissSyrianTaiwaneseThaiTlingit-HaidaTohono O'OdhamTonganTrinidadian and TobagonianTsimshianTurkishU.S. Virgin IslanderUgandanUkrainianUruguayanUteVenezuelanVietnameseWelshWest IndianYakamaYaquiYugoslavianYumanYup'ikZimbabwean
Immigration
NonimmigrantsImmigrantsAfghanistanAfricaAlbaniaArgentinaArmeniaAsiaAustraliaAustriaBahamasBangladeshBarbadosBelarusBelgiumBelizeBoliviaBrazilBulgariaBurma/MyanmarCabo VerdeCambodiaCameroonCanadaCaribbeanCentral AmericaChileChinaColombiaCongoCosta RicaCroatiaCubaCzechoslovakiaDenmarkDominicaDominican RepublicEastern AfricaEastern AsiaEastern EuropeEcuadorEgyptEl SalvadorEnglandEritreaEthiopiaEuropeFijiFranceGermanyGhanaGreeceGrenadaGuatemalaGuyanaHaitiHondurasHong KongHungaryIndiaIndonesiaIranIraqIrelandIsraelItalyJamaicaJapanJordanKazakhstanKenyaKoreaKuwaitLaosLatin AmericaLatviaLebanonLiberiaLithuaniaMalaysiaMexicoMicronesiaMiddle AfricaMoldovaMoroccoNepalNetherlandsNicaraguaNigeriaNorth AmericaNorth MacedoniaNorthern AfricaNorthern EuropeNorwayOceaniaPakistanPanamaPeruPhilippinesPolandPortugalRomaniaRussiaSaudi ArabiaScotlandSenegalSerbiaSierra LeoneSingaporeSomaliaSouth AfricaSouth AmericaSouth Central AsiaSouth Eastern AsiaSouthern EuropeSpainSri LankaSt. Vincent and the GrenadinesSudanSwedenSwitzerlandSyriaTaiwanThailandTrinidad and TobagoTurkeyUgandaUkraineUruguayUzbekistanVenezuelaVietnamWest IndiesWestern AfricaWestern AsiaWestern EuropeYemenZaireZimbabweAzores
Single Mother Households
Income
Poverty
Unemployment
Labor Participation
Family Structure
Vehicle Availability
Education Level
Disability

Single Mother Households Comparison

Immigrants from Bosnia and Herzegovina

Delaware

Average
Fair
6.3%
SINGLE MOTHER HOUSEHOLDS
44.3/ 100
METRIC RATING
176th/ 347
METRIC RANK
6.5%
SINGLE MOTHER HOUSEHOLDS
23.3/ 100
METRIC RATING
189th/ 347
METRIC RANK

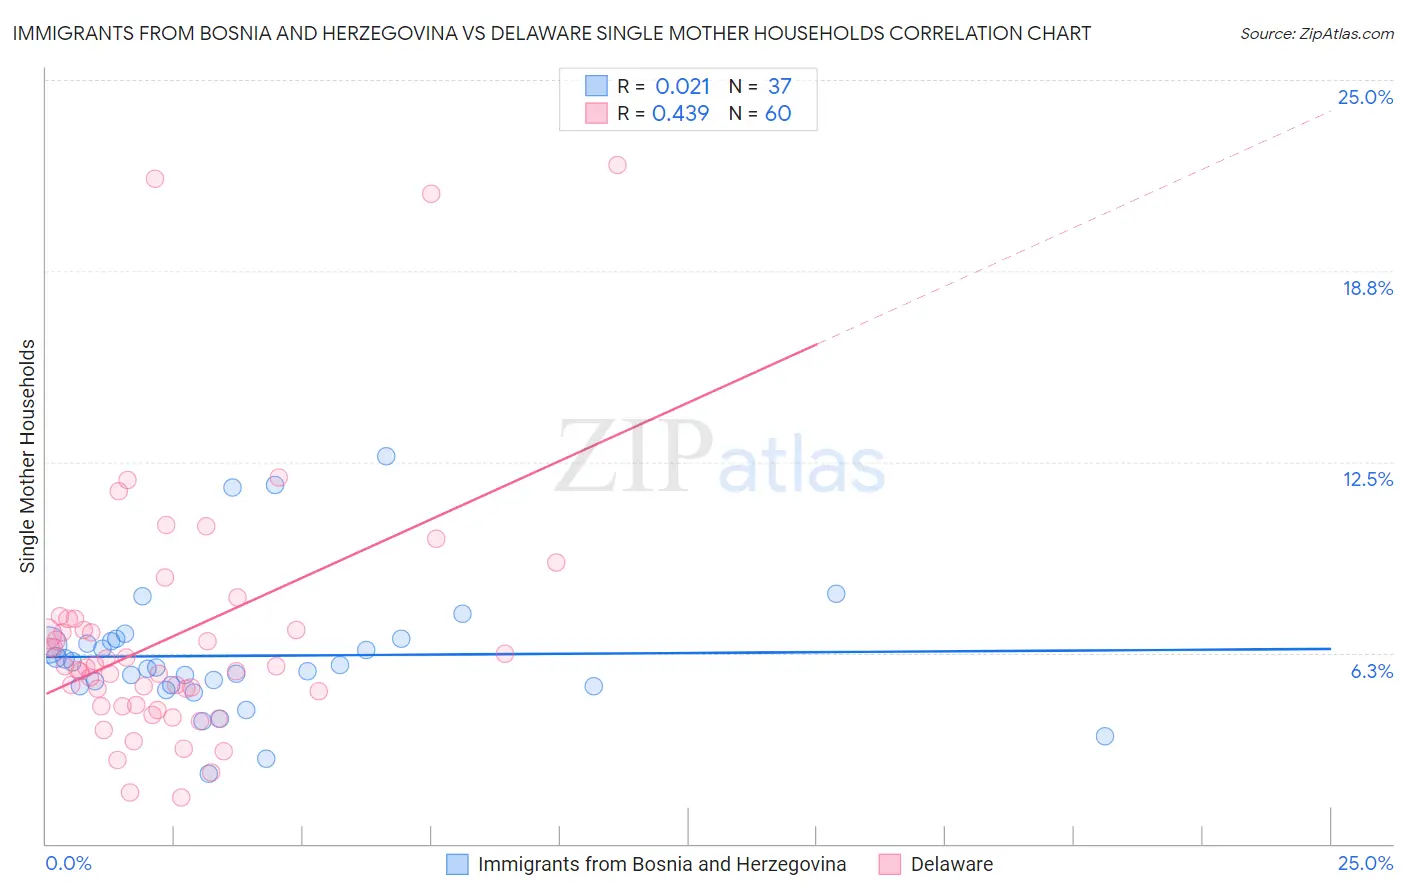
Immigrants from Bosnia and Herzegovina vs Delaware Single Mother Households Correlation Chart

The statistical analysis conducted on geographies consisting of 156,750,530 people shows no correlation between the proportion of Immigrants from Bosnia and Herzegovina and percentage of single mother households in the United States with a correlation coefficient (R) of 0.021 and weighted average of 6.3%. Similarly, the statistical analysis conducted on geographies consisting of 96,147,855 people shows a moderate positive correlation between the proportion of Delaware and percentage of single mother households in the United States with a correlation coefficient (R) of 0.439 and weighted average of 6.5%, a difference of 2.6%.
Immigrants from Bosnia and Herzegovina vs Delaware Single Mother Households

Single Mother Households Correlation Summary

MeasurementImmigrants from Bosnia and HerzegovinaDelaware
Minimum2.3%1.5%
Maximum12.7%22.2%
Range10.4%20.7%
Mean6.2%6.8%
Median5.8%5.8%
Interquartile 25% (IQ1)5.1%4.5%
Interquartile 75% (IQ3)6.7%7.2%
Interquartile Range (IQR)1.5%2.6%
Standard Deviation (Sample)2.2%4.2%
Standard Deviation (Population)2.1%4.1%

Demographics Similar to Immigrants from Bosnia and Herzegovina and Delaware by Single Mother Households

In terms of single mother households, the demographic groups most similar to Immigrants from Bosnia and Herzegovina are Osage (6.4%, a difference of 0.14%), Marshallese (6.3%, a difference of 0.16%), Portuguese (6.4%, a difference of 0.49%), Hmong (6.4%, a difference of 0.51%), and Immigrants from Morocco (6.3%, a difference of 0.62%). Similarly, the demographic groups most similar to Delaware are Ottawa (6.5%, a difference of 0.070%), Immigrants from Afghanistan (6.5%, a difference of 0.20%), Costa Rican (6.5%, a difference of 0.21%), Peruvian (6.5%, a difference of 0.26%), and Samoan (6.5%, a difference of 0.32%).
DemographicsRating | RankSingle Mother Households
Immigrants | South Eastern Asia
52.2
/100
|
#172
Average
6.3%
Immigrants | Vietnam
51.5
/100
|
#173
Average
6.3%
Immigrants | Morocco
50.0
/100
|
#174
Average
6.3%
Marshallese
45.8
/100
|
#175
Average
6.3%
Immigrants | Bosnia and Herzegovina
44.3
/100
|
#176
Average
6.3%
Osage
43.0
/100
|
#177
Average
6.4%
Portuguese
40.0
/100
|
#178
Fair
6.4%
Hmong
39.8
/100
|
#179
Fair
6.4%
Immigrants | Nepal
36.1
/100
|
#180
Fair
6.4%
Spanish
33.4
/100
|
#181
Fair
6.4%
South American Indians
33.4
/100
|
#182
Fair
6.4%
Spaniards
27.8
/100
|
#183
Fair
6.5%
Ethiopians
26.0
/100
|
#184
Fair
6.5%
Ugandans
25.6
/100
|
#185
Fair
6.5%
Costa Ricans
24.8
/100
|
#186
Fair
6.5%
Immigrants | Afghanistan
24.7
/100
|
#187
Fair
6.5%
Ottawa
23.8
/100
|
#188
Fair
6.5%
Delaware
23.3
/100
|
#189
Fair
6.5%
Peruvians
21.6
/100
|
#190
Fair
6.5%
Samoans
21.2
/100
|
#191
Fair
6.5%
Americans
19.0
/100
|
#192
Poor
6.6%