Immigrants from Belarus vs Marshallese Births to Unmarried Women

COMPARE

Immigrants from Belarus
Race
Ancestry
AfghanAfricanAlaska NativeAlaskan AthabascanAlbanianAleutAlsatianAmericanApacheArabArapahoArgentineanArmenianAssyrian/Chaldean/SyriacAustralianAustrianBahamianBangladeshiBarbadianBasqueBelgianBelizeanBermudanBhutaneseBlackfeetBolivianBrazilianBritishBritish West IndianBulgarianBurmeseCajunCambodianCanadianCape VerdeanCarpatho RusynCelticCentral AmericanCentral American IndianCherokeeCheyenneChickasawChileanChineseChippewaChoctawColombianColvilleComancheCosta RicanCreeCreekCroatianCrowCubanCypriotCzechCzechoslovakianDanishDelawareDominicanDutchDutch West IndianEastern EuropeanEcuadorianEgyptianEnglishEstonianEthiopianEuropeanFijianFilipinoFinnishFrenchFrench American IndianFrench CanadianGermanGerman RussianGhanaianGreekGuamanian/ChamorroGuatemalanGuyaneseHaitianHmongHonduranHopiHoumaHungarianIcelanderIndian (Asian)IndonesianInupiatIranianIraqiIrishIroquoisIsraeliItalianJamaicanJapaneseJordanianKenyanKiowaKoreanLaotianLatvianLebaneseLiberianLithuanianLumbeeLuxembourgerMacedonianMalaysianMalteseMenomineeMexicanMexican American IndianMongolianMoroccanNative HawaiianNavajoNepaleseNew ZealanderNicaraguanNigerianNorthern EuropeanNorwegianOkinawanOsageOttawaPaiutePakistaniPalestinianPanamanianParaguayanPennsylvania GermanPeruvianPimaPolishPortuguesePotawatomiPuebloPuerto RicanPuget Sound SalishRomanianRussianSalvadoranSamoanScandinavianScotch-IrishScottishSeminoleSenegaleseSerbianShoshoneSierra LeoneanSiouxSlavicSlovakSloveneSomaliSouth AfricanSouth AmericanSouth American IndianSoviet UnionSpaniardSpanishSpanish AmericanSpanish American IndianSri LankanSubsaharan AfricanSudaneseSwedishSwissSyrianTaiwaneseThaiTlingit-HaidaTohono O'OdhamTonganTrinidadian and TobagonianTsimshianTurkishU.S. Virgin IslanderUgandanUkrainianUruguayanUteVenezuelanVietnameseWelshWest IndianYakamaYaquiYugoslavianYumanYup'ikZimbabwean
Immigration
NonimmigrantsImmigrantsAfghanistanAfricaAlbaniaArgentinaArmeniaAsiaAustraliaAustriaBahamasBangladeshBarbadosBelarusBelgiumBelizeBoliviaBosnia and HerzegovinaBrazilBulgariaBurma/MyanmarCabo VerdeCambodiaCameroonCanadaCaribbeanCentral AmericaChileChinaColombiaCongoCosta RicaCroatiaCubaCzechoslovakiaDenmarkDominicaDominican RepublicEastern AfricaEastern AsiaEastern EuropeEcuadorEgyptEl SalvadorEnglandEritreaEthiopiaEuropeFijiFranceGermanyGhanaGreeceGrenadaGuatemalaGuyanaHaitiHondurasHong KongHungaryIndiaIndonesiaIranIraqIrelandIsraelItalyJamaicaJapanJordanKazakhstanKenyaKoreaKuwaitLaosLatin AmericaLatviaLebanonLiberiaLithuaniaMalaysiaMexicoMicronesiaMiddle AfricaMoldovaMoroccoNepalNetherlandsNicaraguaNigeriaNorth AmericaNorth MacedoniaNorthern AfricaNorthern EuropeNorwayOceaniaPakistanPanamaPeruPhilippinesPolandPortugalRomaniaRussiaSaudi ArabiaScotlandSenegalSerbiaSierra LeoneSingaporeSomaliaSouth AfricaSouth AmericaSouth Central AsiaSouth Eastern AsiaSouthern EuropeSpainSri LankaSt. Vincent and the GrenadinesSudanSwedenSwitzerlandSyriaTaiwanThailandTrinidad and TobagoTurkeyUgandaUkraineUruguayUzbekistanVenezuelaVietnamWest IndiesWestern AfricaWestern AsiaWestern EuropeYemenZaireZimbabweAzores
Marshallese
Race
Ancestry
AfghanAfricanAlaska NativeAlaskan AthabascanAlbanianAleutAlsatianAmericanApacheArabArapahoArgentineanArmenianAssyrian/Chaldean/SyriacAustralianAustrianBahamianBangladeshiBarbadianBasqueBelgianBelizeanBermudanBhutaneseBlackfeetBolivianBrazilianBritishBritish West IndianBulgarianBurmeseCajunCambodianCanadianCape VerdeanCarpatho RusynCelticCentral AmericanCentral American IndianCherokeeCheyenneChickasawChileanChineseChippewaChoctawColombianColvilleComancheCosta RicanCreeCreekCroatianCrowCubanCypriotCzechCzechoslovakianDanishDelawareDominicanDutchDutch West IndianEastern EuropeanEcuadorianEgyptianEnglishEstonianEthiopianEuropeanFijianFilipinoFinnishFrenchFrench American IndianFrench CanadianGermanGerman RussianGhanaianGreekGuamanian/ChamorroGuatemalanGuyaneseHaitianHmongHonduranHopiHoumaHungarianIcelanderIndian (Asian)IndonesianInupiatIranianIraqiIrishIroquoisIsraeliItalianJamaicanJapaneseJordanianKenyanKiowaKoreanLaotianLatvianLebaneseLiberianLithuanianLumbeeLuxembourgerMacedonianMalaysianMalteseMarshalleseMenomineeMexicanMexican American IndianMongolianMoroccanNative HawaiianNavajoNepaleseNew ZealanderNicaraguanNigerianNorthern EuropeanNorwegianOkinawanOsageOttawaPaiutePakistaniPalestinianPanamanianParaguayanPennsylvania GermanPeruvianPimaPolishPortuguesePotawatomiPuebloPuerto RicanPuget Sound SalishRomanianRussianSalvadoranSamoanScandinavianScotch-IrishScottishSeminoleSenegaleseSerbianShoshoneSierra LeoneanSiouxSlavicSlovakSloveneSomaliSouth AfricanSouth AmericanSouth American IndianSoviet UnionSpaniardSpanishSpanish AmericanSpanish American IndianSri LankanSubsaharan AfricanSudaneseSwedishSwissSyrianTaiwaneseThaiTlingit-HaidaTohono O'OdhamTonganTrinidadian and TobagonianTsimshianTurkishU.S. Virgin IslanderUgandanUkrainianUruguayanUteVenezuelanVietnameseWelshWest IndianYakamaYaquiYugoslavianYumanYup'ikZimbabwean
Immigration
NonimmigrantsImmigrantsAfghanistanAfricaAlbaniaArgentinaArmeniaAsiaAustraliaAustriaBahamasBangladeshBarbadosBelgiumBelizeBoliviaBosnia and HerzegovinaBrazilBulgariaBurma/MyanmarCabo VerdeCambodiaCameroonCanadaCaribbeanCentral AmericaChileChinaColombiaCongoCosta RicaCroatiaCubaCzechoslovakiaDenmarkDominicaDominican RepublicEastern AfricaEastern AsiaEastern EuropeEcuadorEgyptEl SalvadorEnglandEritreaEthiopiaEuropeFijiFranceGermanyGhanaGreeceGrenadaGuatemalaGuyanaHaitiHondurasHong KongHungaryIndiaIndonesiaIranIraqIrelandIsraelItalyJamaicaJapanJordanKazakhstanKenyaKoreaKuwaitLaosLatin AmericaLatviaLebanonLiberiaLithuaniaMalaysiaMexicoMicronesiaMiddle AfricaMoldovaMoroccoNepalNetherlandsNicaraguaNigeriaNorth AmericaNorth MacedoniaNorthern AfricaNorthern EuropeNorwayOceaniaPakistanPanamaPeruPhilippinesPolandPortugalRomaniaRussiaSaudi ArabiaScotlandSenegalSerbiaSierra LeoneSingaporeSomaliaSouth AfricaSouth AmericaSouth Central AsiaSouth Eastern AsiaSouthern EuropeSpainSri LankaSt. Vincent and the GrenadinesSudanSwedenSwitzerlandSyriaTaiwanThailandTrinidad and TobagoTurkeyUgandaUkraineUruguayUzbekistanVenezuelaVietnamWest IndiesWestern AfricaWestern AsiaWestern EuropeYemenZaireZimbabweAzores
Births to Unmarried Women
Income
Poverty
Unemployment
Labor Participation
Family Structure
Vehicle Availability
Education Level
Disability

Births to Unmarried Women Comparison

Immigrants from Belarus

Marshallese

Exceptional
Tragic
25.6%
BIRTHS TO UNMARRIED WOMEN
100.0/ 100
METRIC RATING
16th/ 347
METRIC RANK
34.8%
BIRTHS TO UNMARRIED WOMEN
1.6/ 100
METRIC RATING
237th/ 347
METRIC RANK

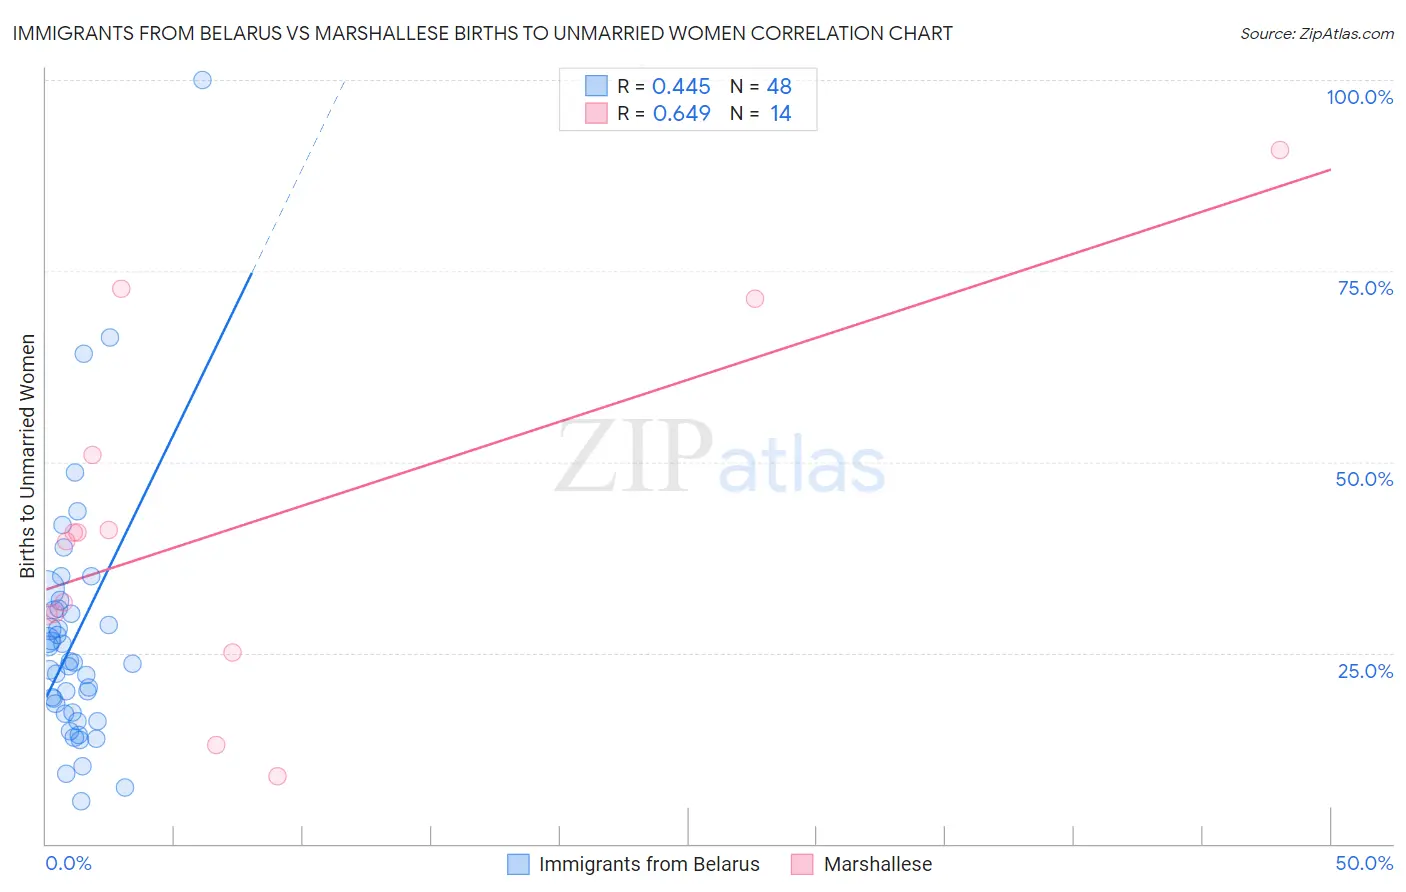
Immigrants from Belarus vs Marshallese Births to Unmarried Women Correlation Chart

The statistical analysis conducted on geographies consisting of 142,991,373 people shows a moderate positive correlation between the proportion of Immigrants from Belarus and percentage of births to unmarried women in the United States with a correlation coefficient (R) of 0.445 and weighted average of 25.6%. Similarly, the statistical analysis conducted on geographies consisting of 14,693,894 people shows a significant positive correlation between the proportion of Marshallese and percentage of births to unmarried women in the United States with a correlation coefficient (R) of 0.649 and weighted average of 34.8%, a difference of 35.5%.
Immigrants from Belarus vs Marshallese Births to Unmarried Women

Births to Unmarried Women Correlation Summary

MeasurementImmigrants from BelarusMarshallese
Minimum5.6%8.9%
Maximum100.0%90.9%
Range94.4%82.0%
Mean27.0%41.9%
Median23.7%40.2%
Interquartile 25% (IQ1)17.1%30.0%
Interquartile 75% (IQ3)30.7%51.0%
Interquartile Range (IQR)13.5%21.0%
Standard Deviation (Sample)16.5%23.0%
Standard Deviation (Population)16.3%22.2%

Similar Demographics by Births to Unmarried Women

Demographics Similar to Immigrants from Belarus by Births to Unmarried Women

In terms of births to unmarried women, the demographic groups most similar to Immigrants from Belarus are Immigrants from Singapore (25.6%, a difference of 0.050%), Immigrants from Uzbekistan (25.8%, a difference of 0.57%), Immigrants from Lebanon (25.3%, a difference of 1.2%), Iranian (25.3%, a difference of 1.3%), and Indian (Asian) (25.3%, a difference of 1.5%).
DemographicsRating | RankBirths to Unmarried Women
Immigrants | South Central Asia
100.0
/100
|
#9
Exceptional
24.7%
Immigrants | Eastern Asia
100.0
/100
|
#10
Exceptional
25.0%
Immigrants | Israel
100.0
/100
|
#11
Exceptional
25.1%
Indians (Asian)
100.0
/100
|
#12
Exceptional
25.3%
Iranians
100.0
/100
|
#13
Exceptional
25.3%
Immigrants | Lebanon
100.0
/100
|
#14
Exceptional
25.3%
Immigrants | Singapore
100.0
/100
|
#15
Exceptional
25.6%
Immigrants | Belarus
100.0
/100
|
#16
Exceptional
25.6%
Immigrants | Uzbekistan
100.0
/100
|
#17
Exceptional
25.8%
Immigrants | Armenia
99.9
/100
|
#18
Exceptional
26.1%
Armenians
99.9
/100
|
#19
Exceptional
26.2%
Immigrants | Korea
99.9
/100
|
#20
Exceptional
26.3%
Soviet Union
99.9
/100
|
#21
Exceptional
26.3%
Burmese
99.9
/100
|
#22
Exceptional
26.4%
Immigrants | Japan
99.9
/100
|
#23
Exceptional
26.4%

Demographics Similar to Marshallese by Births to Unmarried Women

In terms of births to unmarried women, the demographic groups most similar to Marshallese are Immigrants from Cambodia (34.8%, a difference of 0.060%), Immigrants from Cameroon (34.7%, a difference of 0.070%), Sierra Leonean (34.9%, a difference of 0.28%), Immigrants from Middle Africa (34.9%, a difference of 0.53%), and Immigrants from Guyana (35.0%, a difference of 0.57%).
DemographicsRating | RankBirths to Unmarried Women
Ghanaians
3.1
/100
|
#230
Tragic
34.3%
Native Hawaiians
2.9
/100
|
#231
Tragic
34.3%
French Canadians
2.5
/100
|
#232
Tragic
34.4%
Bangladeshis
2.5
/100
|
#233
Tragic
34.4%
Immigrants | Zaire
2.3
/100
|
#234
Tragic
34.5%
Immigrants | Ghana
2.2
/100
|
#235
Tragic
34.5%
Immigrants | Cameroon
1.6
/100
|
#236
Tragic
34.7%
Marshallese
1.6
/100
|
#237
Tragic
34.8%
Immigrants | Cambodia
1.6
/100
|
#238
Tragic
34.8%
Sierra Leoneans
1.4
/100
|
#239
Tragic
34.9%
Immigrants | Middle Africa
1.2
/100
|
#240
Tragic
34.9%
Immigrants | Guyana
1.2
/100
|
#241
Tragic
35.0%
Indonesians
1.2
/100
|
#242
Tragic
35.0%
Japanese
0.9
/100
|
#243
Tragic
35.2%
Guyanese
0.9
/100
|
#244
Tragic
35.2%