Immigrants from Belarus vs Lithuanian Family Households with Children

COMPARE

Immigrants from Belarus
Race
Ancestry
AfghanAfricanAlaska NativeAlaskan AthabascanAlbanianAleutAlsatianAmericanApacheArabArapahoArgentineanArmenianAssyrian/Chaldean/SyriacAustralianAustrianBahamianBangladeshiBarbadianBasqueBelgianBelizeanBermudanBhutaneseBlackfeetBolivianBrazilianBritishBritish West IndianBulgarianBurmeseCajunCambodianCanadianCape VerdeanCarpatho RusynCelticCentral AmericanCentral American IndianCherokeeCheyenneChickasawChileanChineseChippewaChoctawColombianColvilleComancheCosta RicanCreeCreekCroatianCrowCubanCypriotCzechCzechoslovakianDanishDelawareDominicanDutchDutch West IndianEastern EuropeanEcuadorianEgyptianEnglishEstonianEthiopianEuropeanFijianFilipinoFinnishFrenchFrench American IndianFrench CanadianGermanGerman RussianGhanaianGreekGuamanian/ChamorroGuatemalanGuyaneseHaitianHmongHonduranHopiHoumaHungarianIcelanderIndian (Asian)IndonesianInupiatIranianIraqiIrishIroquoisIsraeliItalianJamaicanJapaneseJordanianKenyanKiowaKoreanLaotianLatvianLebaneseLiberianLumbeeLuxembourgerMacedonianMalaysianMalteseMarshalleseMenomineeMexicanMexican American IndianMongolianMoroccanNative HawaiianNavajoNepaleseNew ZealanderNicaraguanNigerianNorthern EuropeanNorwegianOkinawanOsageOttawaPaiutePakistaniPalestinianPanamanianParaguayanPennsylvania GermanPeruvianPimaPolishPortuguesePotawatomiPuebloPuerto RicanPuget Sound SalishRomanianRussianSalvadoranSamoanScandinavianScotch-IrishScottishSeminoleSenegaleseSerbianShoshoneSierra LeoneanSiouxSlavicSlovakSloveneSomaliSouth AfricanSouth AmericanSouth American IndianSoviet UnionSpaniardSpanishSpanish AmericanSpanish American IndianSri LankanSubsaharan AfricanSudaneseSwedishSwissSyrianTaiwaneseThaiTlingit-HaidaTohono O'OdhamTonganTrinidadian and TobagonianTsimshianTurkishU.S. Virgin IslanderUgandanUkrainianUruguayanUteVenezuelanVietnameseWelshWest IndianYakamaYaquiYugoslavianYumanYup'ikZimbabwean
Immigration
NonimmigrantsImmigrantsAfghanistanAfricaAlbaniaArgentinaArmeniaAsiaAustraliaAustriaBahamasBangladeshBarbadosBelarusBelgiumBelizeBoliviaBosnia and HerzegovinaBrazilBulgariaBurma/MyanmarCabo VerdeCambodiaCameroonCanadaCaribbeanCentral AmericaChileChinaColombiaCongoCosta RicaCroatiaCubaCzechoslovakiaDenmarkDominicaDominican RepublicEastern AfricaEastern AsiaEastern EuropeEcuadorEgyptEl SalvadorEnglandEritreaEthiopiaEuropeFijiFranceGermanyGhanaGreeceGrenadaGuatemalaGuyanaHaitiHondurasHong KongHungaryIndiaIndonesiaIranIraqIrelandIsraelItalyJamaicaJapanJordanKazakhstanKenyaKoreaKuwaitLaosLatin AmericaLatviaLebanonLiberiaLithuaniaMalaysiaMexicoMicronesiaMiddle AfricaMoldovaMoroccoNepalNetherlandsNicaraguaNigeriaNorth AmericaNorth MacedoniaNorthern AfricaNorthern EuropeNorwayOceaniaPakistanPanamaPeruPhilippinesPolandPortugalRomaniaRussiaSaudi ArabiaScotlandSenegalSerbiaSierra LeoneSingaporeSomaliaSouth AfricaSouth AmericaSouth Central AsiaSouth Eastern AsiaSouthern EuropeSpainSri LankaSt. Vincent and the GrenadinesSudanSwedenSwitzerlandSyriaTaiwanThailandTrinidad and TobagoTurkeyUgandaUkraineUruguayUzbekistanVenezuelaVietnamWest IndiesWestern AfricaWestern AsiaWestern EuropeYemenZaireZimbabweAzores
Lithuanian
Race
Ancestry
AfghanAfricanAlaska NativeAlaskan AthabascanAlbanianAleutAlsatianAmericanApacheArabArapahoArgentineanArmenianAssyrian/Chaldean/SyriacAustralianAustrianBahamianBangladeshiBarbadianBasqueBelgianBelizeanBermudanBhutaneseBlackfeetBolivianBrazilianBritishBritish West IndianBulgarianBurmeseCajunCambodianCanadianCape VerdeanCarpatho RusynCelticCentral AmericanCentral American IndianCherokeeCheyenneChickasawChileanChineseChippewaChoctawColombianColvilleComancheCosta RicanCreeCreekCroatianCrowCubanCypriotCzechCzechoslovakianDanishDelawareDominicanDutchDutch West IndianEastern EuropeanEcuadorianEgyptianEnglishEstonianEthiopianEuropeanFijianFilipinoFinnishFrenchFrench American IndianFrench CanadianGermanGerman RussianGhanaianGreekGuamanian/ChamorroGuatemalanGuyaneseHaitianHmongHonduranHopiHoumaHungarianIcelanderIndian (Asian)IndonesianInupiatIranianIraqiIrishIroquoisIsraeliItalianJamaicanJapaneseJordanianKenyanKiowaKoreanLaotianLatvianLebaneseLiberianLithuanianLumbeeLuxembourgerMacedonianMalaysianMalteseMarshalleseMenomineeMexicanMexican American IndianMongolianMoroccanNative HawaiianNavajoNepaleseNew ZealanderNicaraguanNigerianNorthern EuropeanNorwegianOkinawanOsageOttawaPaiutePakistaniPalestinianPanamanianParaguayanPennsylvania GermanPeruvianPimaPolishPortuguesePotawatomiPuebloPuerto RicanPuget Sound SalishRomanianRussianSalvadoranSamoanScandinavianScotch-IrishScottishSeminoleSenegaleseSerbianShoshoneSierra LeoneanSiouxSlavicSlovakSloveneSomaliSouth AfricanSouth AmericanSouth American IndianSoviet UnionSpaniardSpanishSpanish AmericanSpanish American IndianSri LankanSubsaharan AfricanSudaneseSwedishSwissSyrianTaiwaneseThaiTlingit-HaidaTohono O'OdhamTonganTrinidadian and TobagonianTsimshianTurkishU.S. Virgin IslanderUgandanUkrainianUruguayanUteVenezuelanVietnameseWelshWest IndianYakamaYaquiYugoslavianYumanYup'ikZimbabwean
Immigration
NonimmigrantsImmigrantsAfghanistanAfricaAlbaniaArgentinaArmeniaAsiaAustraliaAustriaBahamasBangladeshBarbadosBelgiumBelizeBoliviaBosnia and HerzegovinaBrazilBulgariaBurma/MyanmarCabo VerdeCambodiaCameroonCanadaCaribbeanCentral AmericaChileChinaColombiaCongoCosta RicaCroatiaCubaCzechoslovakiaDenmarkDominicaDominican RepublicEastern AfricaEastern AsiaEastern EuropeEcuadorEgyptEl SalvadorEnglandEritreaEthiopiaEuropeFijiFranceGermanyGhanaGreeceGrenadaGuatemalaGuyanaHaitiHondurasHong KongHungaryIndiaIndonesiaIranIraqIrelandIsraelItalyJamaicaJapanJordanKazakhstanKenyaKoreaKuwaitLaosLatin AmericaLatviaLebanonLiberiaLithuaniaMalaysiaMexicoMicronesiaMiddle AfricaMoldovaMoroccoNepalNetherlandsNicaraguaNigeriaNorth AmericaNorth MacedoniaNorthern AfricaNorthern EuropeNorwayOceaniaPakistanPanamaPeruPhilippinesPolandPortugalRomaniaRussiaSaudi ArabiaScotlandSenegalSerbiaSierra LeoneSingaporeSomaliaSouth AfricaSouth AmericaSouth Central AsiaSouth Eastern AsiaSouthern EuropeSpainSri LankaSt. Vincent and the GrenadinesSudanSwedenSwitzerlandSyriaTaiwanThailandTrinidad and TobagoTurkeyUgandaUkraineUruguayUzbekistanVenezuelaVietnamWest IndiesWestern AfricaWestern AsiaWestern EuropeYemenZaireZimbabweAzores
Family Households with Children
Income
Poverty
Unemployment
Labor Participation
Family Structure
Vehicle Availability
Education Level
Disability

Family Households with Children Comparison

Immigrants from Belarus

Lithuanians

Tragic
Tragic
26.8%
FAMILY HOUSEHOLDS WITH CHILDREN
1.1/ 100
METRIC RATING
261st/ 347
METRIC RANK
26.6%
FAMILY HOUSEHOLDS WITH CHILDREN
0.3/ 100
METRIC RATING
281st/ 347
METRIC RANK

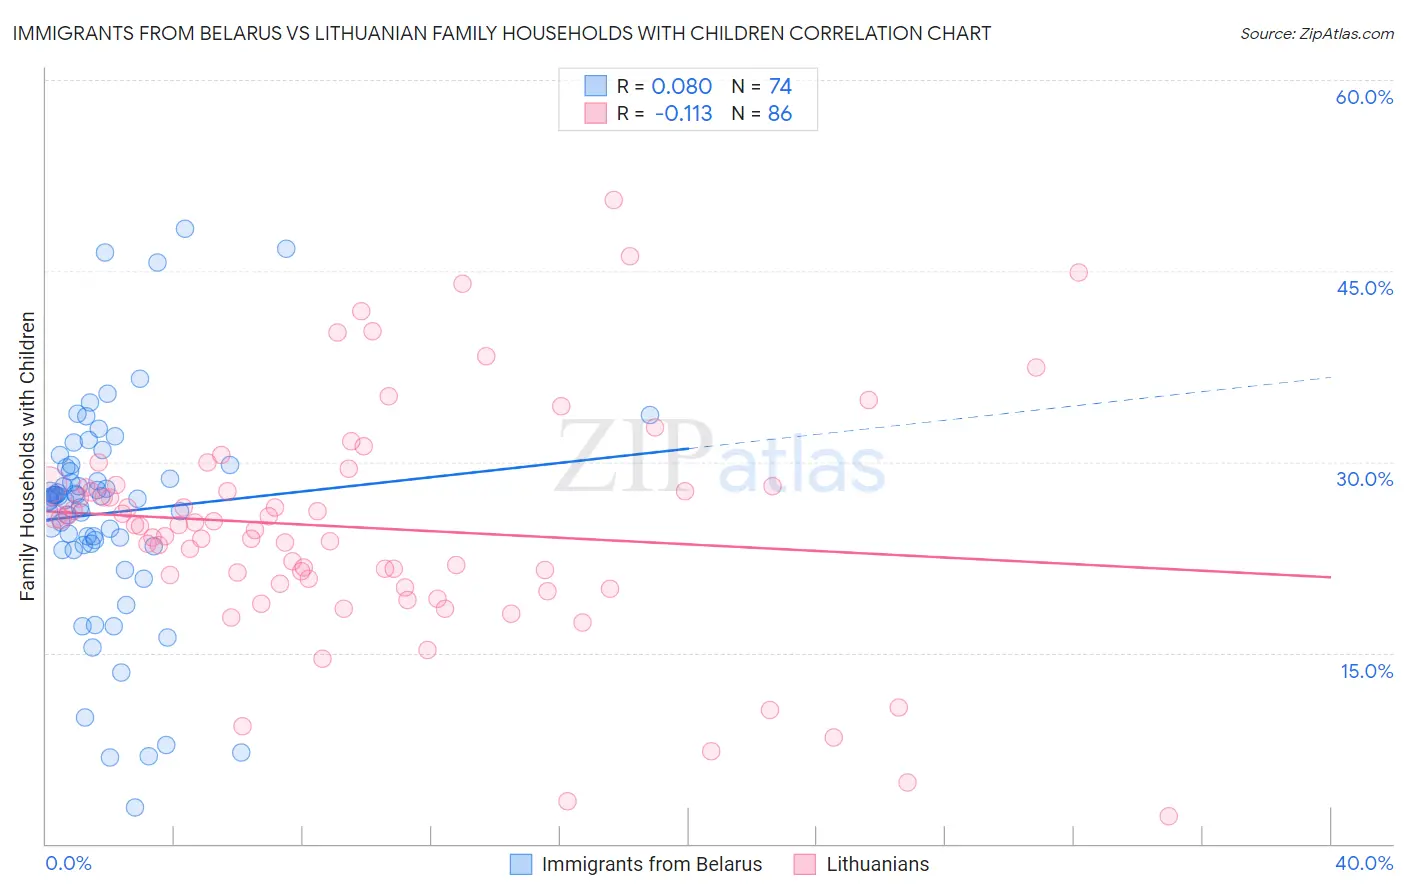
Immigrants from Belarus vs Lithuanian Family Households with Children Correlation Chart

The statistical analysis conducted on geographies consisting of 150,186,430 people shows a slight positive correlation between the proportion of Immigrants from Belarus and percentage of family households with children in the United States with a correlation coefficient (R) of 0.080 and weighted average of 26.8%. Similarly, the statistical analysis conducted on geographies consisting of 421,521,006 people shows a poor negative correlation between the proportion of Lithuanians and percentage of family households with children in the United States with a correlation coefficient (R) of -0.113 and weighted average of 26.6%, a difference of 0.72%.
Immigrants from Belarus vs Lithuanian Family Households with Children

Family Households with Children Correlation Summary

MeasurementImmigrants from BelarusLithuanian
Minimum2.8%2.2%
Maximum48.3%50.6%
Range45.4%48.4%
Mean26.0%24.8%
Median27.2%25.0%
Interquartile 25% (IQ1)23.5%20.4%
Interquartile 75% (IQ3)29.5%28.1%
Interquartile Range (IQR)6.0%7.7%
Standard Deviation (Sample)8.6%9.1%
Standard Deviation (Population)8.6%9.0%

Demographics Similar to Immigrants from Belarus and Lithuanians by Family Households with Children

In terms of family households with children, the demographic groups most similar to Immigrants from Belarus are Immigrants from Russia (26.8%, a difference of 0.060%), Immigrants from North Macedonia (26.7%, a difference of 0.060%), Taiwanese (26.7%, a difference of 0.090%), Chippewa (26.7%, a difference of 0.10%), and Maltese (26.7%, a difference of 0.11%). Similarly, the demographic groups most similar to Lithuanians are Senegalese (26.6%, a difference of 0.090%), Finnish (26.6%, a difference of 0.12%), Immigrants from Europe (26.6%, a difference of 0.14%), Celtic (26.6%, a difference of 0.20%), and Immigrants from Spain (26.6%, a difference of 0.28%).
DemographicsRating | RankFamily Households with Children
Immigrants | Belarus
1.1
/100
|
#261
Tragic
26.8%
Immigrants | Russia
1.0
/100
|
#262
Tragic
26.8%
Immigrants | North Macedonia
1.0
/100
|
#263
Tragic
26.7%
Taiwanese
0.9
/100
|
#264
Tragic
26.7%
Chippewa
0.9
/100
|
#265
Tragic
26.7%
Maltese
0.9
/100
|
#266
Tragic
26.7%
Immigrants | Uzbekistan
0.9
/100
|
#267
Tragic
26.7%
Immigrants | Belgium
0.9
/100
|
#268
Tragic
26.7%
Immigrants | Denmark
0.8
/100
|
#269
Tragic
26.7%
Immigrants | Zaire
0.7
/100
|
#270
Tragic
26.7%
French
0.7
/100
|
#271
Tragic
26.7%
Somalis
0.7
/100
|
#272
Tragic
26.7%
Immigrants | Hungary
0.6
/100
|
#273
Tragic
26.7%
Eastern Europeans
0.6
/100
|
#274
Tragic
26.7%
Immigrants | Northern Europe
0.5
/100
|
#275
Tragic
26.7%
Immigrants | Spain
0.5
/100
|
#276
Tragic
26.6%
Celtics
0.4
/100
|
#277
Tragic
26.6%
Immigrants | Europe
0.4
/100
|
#278
Tragic
26.6%
Finns
0.4
/100
|
#279
Tragic
26.6%
Senegalese
0.4
/100
|
#280
Tragic
26.6%
Lithuanians
0.3
/100
|
#281
Tragic
26.6%