Immigrants from Belarus vs German Russian Single Mother Households
COMPARE
Immigrants from Belarus
German Russian
Single Mother Households
Single Mother Households Comparison
Immigrants from Belarus
German Russians
5.5%
SINGLE MOTHER HOUSEHOLDS
99.2/ 100
METRIC RATING
51st/ 347
METRIC RANK
6.7%
SINGLE MOTHER HOUSEHOLDS
11.5/ 100
METRIC RATING
206th/ 347
METRIC RANK
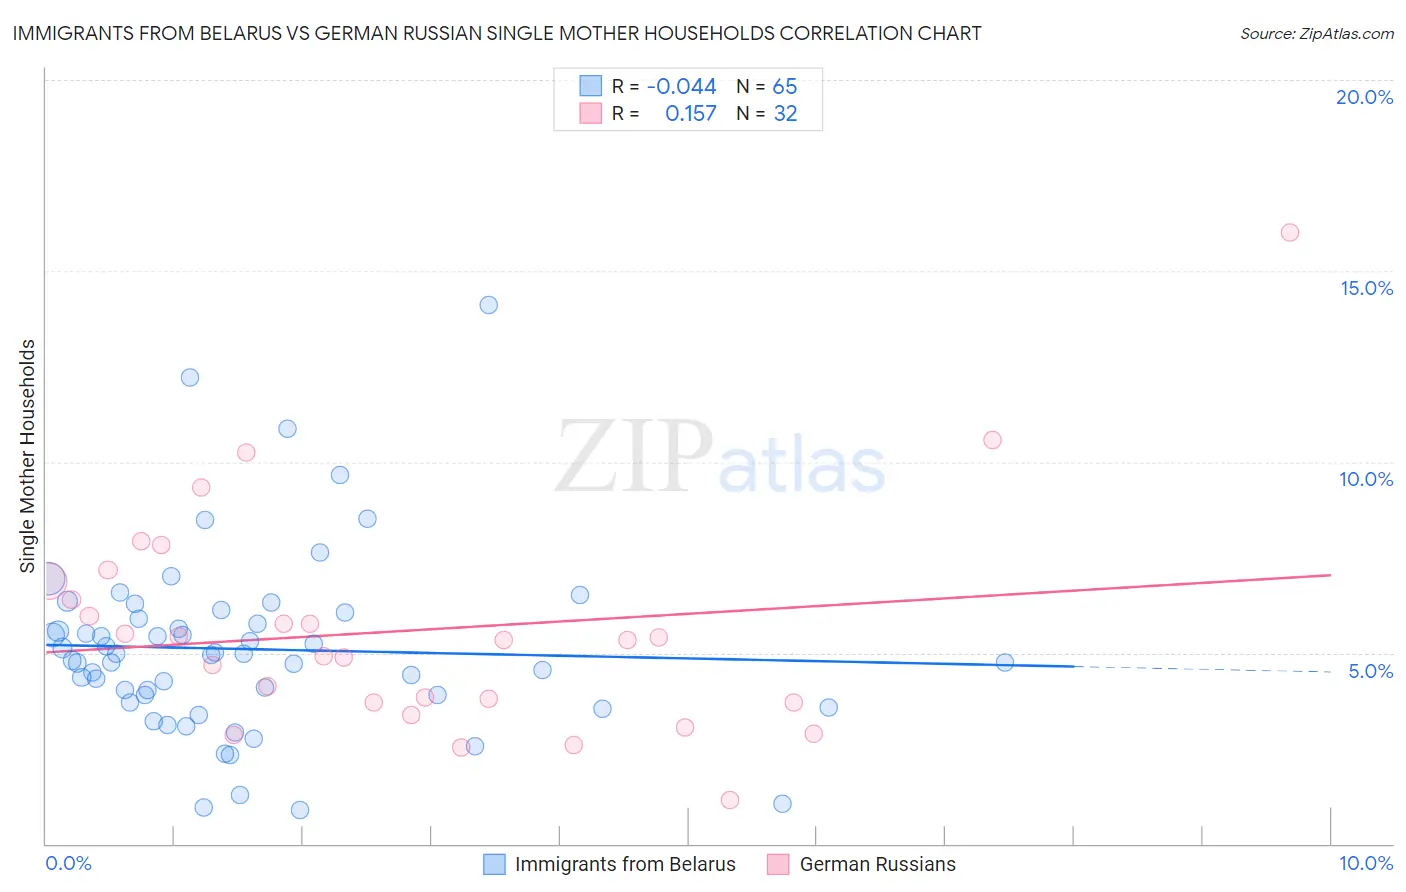
Immigrants from Belarus vs German Russian Single Mother Households Correlation Chart
The statistical analysis conducted on geographies consisting of 150,091,911 people shows no correlation between the proportion of Immigrants from Belarus and percentage of single mother households in the United States with a correlation coefficient (R) of -0.044 and weighted average of 5.5%. Similarly, the statistical analysis conducted on geographies consisting of 96,402,905 people shows a poor positive correlation between the proportion of German Russians and percentage of single mother households in the United States with a correlation coefficient (R) of 0.157 and weighted average of 6.7%, a difference of 21.4%.
Single Mother Households Correlation Summary
| Measurement | Immigrants from Belarus | German Russian |
| Minimum | 0.87% | 1.1% |
| Maximum | 14.1% | 16.0% |
| Range | 13.2% | 14.9% |
| Mean | 5.1% | 5.6% |
| Median | 5.0% | 5.3% |
| Interquartile 25% (IQ1) | 3.8% | 3.7% |
| Interquartile 75% (IQ3) | 6.0% | 6.6% |
| Interquartile Range (IQR) | 2.2% | 2.9% |
| Standard Deviation (Sample) | 2.4% | 2.9% |
| Standard Deviation (Population) | 2.4% | 2.9% |
Similar Demographics by Single Mother Households
Demographics Similar to Immigrants from Belarus by Single Mother Households
In terms of single mother households, the demographic groups most similar to Immigrants from Belarus are Immigrants from Scotland (5.5%, a difference of 0.020%), Swedish (5.5%, a difference of 0.070%), Immigrants from Russia (5.5%, a difference of 0.17%), Immigrants from Lebanon (5.5%, a difference of 0.19%), and Immigrants from Latvia (5.5%, a difference of 0.21%).
| Demographics | Rating | Rank | Single Mother Households |
| Lithuanians | 99.4 /100 | #44 | Exceptional 5.4% |
| Immigrants | Croatia | 99.4 /100 | #45 | Exceptional 5.4% |
| Croatians | 99.3 /100 | #46 | Exceptional 5.5% |
| Norwegians | 99.3 /100 | #47 | Exceptional 5.5% |
| Turks | 99.2 /100 | #48 | Exceptional 5.5% |
| Immigrants | Latvia | 99.2 /100 | #49 | Exceptional 5.5% |
| Immigrants | Scotland | 99.2 /100 | #50 | Exceptional 5.5% |
| Immigrants | Belarus | 99.2 /100 | #51 | Exceptional 5.5% |
| Swedes | 99.1 /100 | #52 | Exceptional 5.5% |
| Immigrants | Russia | 99.1 /100 | #53 | Exceptional 5.5% |
| Immigrants | Lebanon | 99.1 /100 | #54 | Exceptional 5.5% |
| Immigrants | Denmark | 99.1 /100 | #55 | Exceptional 5.5% |
| Immigrants | Romania | 99.0 /100 | #56 | Exceptional 5.5% |
| Immigrants | Europe | 99.0 /100 | #57 | Exceptional 5.5% |
| Danes | 98.9 /100 | #58 | Exceptional 5.5% |
Demographics Similar to German Russians by Single Mother Households
In terms of single mother households, the demographic groups most similar to German Russians are Immigrants from South America (6.7%, a difference of 0.0%), Vietnamese (6.7%, a difference of 0.050%), Cree (6.7%, a difference of 0.080%), Immigrants from Fiji (6.7%, a difference of 0.10%), and Immigrants from Peru (6.7%, a difference of 0.11%).
| Demographics | Rating | Rank | Single Mother Households |
| Potawatomi | 15.5 /100 | #199 | Poor 6.6% |
| Immigrants | Ethiopia | 14.7 /100 | #200 | Poor 6.6% |
| Venezuelans | 12.9 /100 | #201 | Poor 6.6% |
| Guamanians/Chamorros | 12.4 /100 | #202 | Poor 6.6% |
| Immigrants | Peru | 12.0 /100 | #203 | Poor 6.7% |
| Immigrants | Fiji | 11.9 /100 | #204 | Poor 6.7% |
| Cree | 11.9 /100 | #205 | Poor 6.7% |
| German Russians | 11.5 /100 | #206 | Poor 6.7% |
| Immigrants | South America | 11.5 /100 | #207 | Poor 6.7% |
| Vietnamese | 11.3 /100 | #208 | Poor 6.7% |
| Immigrants | Colombia | 10.5 /100 | #209 | Poor 6.7% |
| Immigrants | Nonimmigrants | 10.4 /100 | #210 | Poor 6.7% |
| Immigrants | Venezuela | 8.5 /100 | #211 | Tragic 6.7% |
| Immigrants | Eritrea | 8.4 /100 | #212 | Tragic 6.7% |
| Immigrants | Costa Rica | 8.2 /100 | #213 | Tragic 6.7% |