Immigrants from Bangladesh vs Czech Divorced or Separated

COMPARE

Immigrants from Bangladesh
Race
Ancestry
AfghanAfricanAlaska NativeAlaskan AthabascanAlbanianAleutAlsatianAmericanApacheArabArapahoArgentineanArmenianAssyrian/Chaldean/SyriacAustralianAustrianBahamianBangladeshiBarbadianBasqueBelgianBelizeanBermudanBhutaneseBlackfeetBolivianBrazilianBritishBritish West IndianBulgarianBurmeseCajunCambodianCanadianCape VerdeanCarpatho RusynCelticCentral AmericanCentral American IndianCherokeeCheyenneChickasawChileanChineseChippewaChoctawColombianColvilleComancheCosta RicanCreeCreekCroatianCrowCubanCypriotCzechoslovakianDanishDelawareDominicanDutchDutch West IndianEastern EuropeanEcuadorianEgyptianEnglishEstonianEthiopianEuropeanFijianFilipinoFinnishFrenchFrench American IndianFrench CanadianGermanGerman RussianGhanaianGreekGuamanian/ChamorroGuatemalanGuyaneseHaitianHmongHonduranHopiHoumaHungarianIcelanderIndian (Asian)IndonesianInupiatIranianIraqiIrishIroquoisIsraeliItalianJamaicanJapaneseJordanianKenyanKiowaKoreanLaotianLatvianLebaneseLiberianLithuanianLumbeeLuxembourgerMacedonianMalaysianMalteseMarshalleseMenomineeMexicanMexican American IndianMongolianMoroccanNative HawaiianNavajoNepaleseNew ZealanderNicaraguanNigerianNorthern EuropeanNorwegianOkinawanOsageOttawaPaiutePakistaniPalestinianPanamanianParaguayanPennsylvania GermanPeruvianPimaPolishPortuguesePotawatomiPuebloPuerto RicanPuget Sound SalishRomanianRussianSalvadoranSamoanScandinavianScotch-IrishScottishSeminoleSenegaleseSerbianShoshoneSierra LeoneanSiouxSlavicSlovakSloveneSomaliSouth AfricanSouth AmericanSouth American IndianSoviet UnionSpaniardSpanishSpanish AmericanSpanish American IndianSri LankanSubsaharan AfricanSudaneseSwedishSwissSyrianTaiwaneseThaiTlingit-HaidaTohono O'OdhamTonganTrinidadian and TobagonianTsimshianTurkishU.S. Virgin IslanderUgandanUkrainianUruguayanUteVenezuelanVietnameseWelshWest IndianYakamaYaquiYugoslavianYumanYup'ikZimbabwean
Immigration
NonimmigrantsImmigrantsAfghanistanAfricaAlbaniaArgentinaArmeniaAsiaAustraliaAustriaBahamasBangladeshBarbadosBelarusBelgiumBelizeBoliviaBosnia and HerzegovinaBrazilBulgariaBurma/MyanmarCabo VerdeCambodiaCameroonCanadaCaribbeanCentral AmericaChileChinaColombiaCongoCosta RicaCroatiaCubaCzechoslovakiaDenmarkDominicaDominican RepublicEastern AfricaEastern AsiaEastern EuropeEcuadorEgyptEl SalvadorEnglandEritreaEthiopiaEuropeFijiFranceGermanyGhanaGreeceGrenadaGuatemalaGuyanaHaitiHondurasHong KongHungaryIndiaIndonesiaIranIraqIrelandIsraelItalyJamaicaJapanJordanKazakhstanKenyaKoreaKuwaitLaosLatin AmericaLatviaLebanonLiberiaLithuaniaMalaysiaMexicoMicronesiaMiddle AfricaMoldovaMoroccoNepalNetherlandsNicaraguaNigeriaNorth AmericaNorth MacedoniaNorthern AfricaNorthern EuropeNorwayOceaniaPakistanPanamaPeruPhilippinesPolandPortugalRomaniaRussiaSaudi ArabiaScotlandSenegalSerbiaSierra LeoneSingaporeSomaliaSouth AfricaSouth AmericaSouth Central AsiaSouth Eastern AsiaSouthern EuropeSpainSri LankaSt. Vincent and the GrenadinesSudanSwedenSwitzerlandSyriaTaiwanThailandTrinidad and TobagoTurkeyUgandaUkraineUruguayUzbekistanVenezuelaVietnamWest IndiesWestern AfricaWestern AsiaWestern EuropeYemenZaireZimbabweAzores
Czech
Race
Ancestry
AfghanAfricanAlaska NativeAlaskan AthabascanAlbanianAleutAlsatianAmericanApacheArabArapahoArgentineanArmenianAssyrian/Chaldean/SyriacAustralianAustrianBahamianBangladeshiBarbadianBasqueBelgianBelizeanBermudanBhutaneseBlackfeetBolivianBrazilianBritishBritish West IndianBulgarianBurmeseCajunCambodianCanadianCape VerdeanCarpatho RusynCelticCentral AmericanCentral American IndianCherokeeCheyenneChickasawChileanChineseChippewaChoctawColombianColvilleComancheCosta RicanCreeCreekCroatianCrowCubanCypriotCzechCzechoslovakianDanishDelawareDominicanDutchDutch West IndianEastern EuropeanEcuadorianEgyptianEnglishEstonianEthiopianEuropeanFijianFilipinoFinnishFrenchFrench American IndianFrench CanadianGermanGerman RussianGhanaianGreekGuamanian/ChamorroGuatemalanGuyaneseHaitianHmongHonduranHopiHoumaHungarianIcelanderIndian (Asian)IndonesianInupiatIranianIraqiIrishIroquoisIsraeliItalianJamaicanJapaneseJordanianKenyanKiowaKoreanLaotianLatvianLebaneseLiberianLithuanianLumbeeLuxembourgerMacedonianMalaysianMalteseMarshalleseMenomineeMexicanMexican American IndianMongolianMoroccanNative HawaiianNavajoNepaleseNew ZealanderNicaraguanNigerianNorthern EuropeanNorwegianOkinawanOsageOttawaPaiutePakistaniPalestinianPanamanianParaguayanPennsylvania GermanPeruvianPimaPolishPortuguesePotawatomiPuebloPuerto RicanPuget Sound SalishRomanianRussianSalvadoranSamoanScandinavianScotch-IrishScottishSeminoleSenegaleseSerbianShoshoneSierra LeoneanSiouxSlavicSlovakSloveneSomaliSouth AfricanSouth AmericanSouth American IndianSoviet UnionSpaniardSpanishSpanish AmericanSpanish American IndianSri LankanSubsaharan AfricanSudaneseSwedishSwissSyrianTaiwaneseThaiTlingit-HaidaTohono O'OdhamTonganTrinidadian and TobagonianTsimshianTurkishU.S. Virgin IslanderUgandanUkrainianUruguayanUteVenezuelanVietnameseWelshWest IndianYakamaYaquiYugoslavianYumanYup'ikZimbabwean
Immigration
NonimmigrantsImmigrantsAfghanistanAfricaAlbaniaArgentinaArmeniaAsiaAustraliaAustriaBahamasBarbadosBelarusBelgiumBelizeBoliviaBosnia and HerzegovinaBrazilBulgariaBurma/MyanmarCabo VerdeCambodiaCameroonCanadaCaribbeanCentral AmericaChileChinaColombiaCongoCosta RicaCroatiaCubaCzechoslovakiaDenmarkDominicaDominican RepublicEastern AfricaEastern AsiaEastern EuropeEcuadorEgyptEl SalvadorEnglandEritreaEthiopiaEuropeFijiFranceGermanyGhanaGreeceGrenadaGuatemalaGuyanaHaitiHondurasHong KongHungaryIndiaIndonesiaIranIraqIrelandIsraelItalyJamaicaJapanJordanKazakhstanKenyaKoreaKuwaitLaosLatin AmericaLatviaLebanonLiberiaLithuaniaMalaysiaMexicoMicronesiaMiddle AfricaMoldovaMoroccoNepalNetherlandsNicaraguaNigeriaNorth AmericaNorth MacedoniaNorthern AfricaNorthern EuropeNorwayOceaniaPakistanPanamaPeruPhilippinesPolandPortugalRomaniaRussiaSaudi ArabiaScotlandSenegalSerbiaSierra LeoneSingaporeSomaliaSouth AfricaSouth AmericaSouth Central AsiaSouth Eastern AsiaSouthern EuropeSpainSri LankaSt. Vincent and the GrenadinesSudanSwedenSwitzerlandSyriaTaiwanThailandTrinidad and TobagoTurkeyUgandaUkraineUruguayUzbekistanVenezuelaVietnamWest IndiesWestern AfricaWestern AsiaWestern EuropeYemenZaireZimbabweAzores
Divorced or Separated
Income
Poverty
Unemployment
Labor Participation
Family Structure
Vehicle Availability
Education Level
Disability

Divorced or Separated Comparison

Immigrants from Bangladesh

Czechs

Exceptional
Good
11.0%
DIVORCED OR SEPARATED
100.0/ 100
METRIC RATING
27th/ 347
METRIC RANK
11.9%
DIVORCED OR SEPARATED
76.4/ 100
METRIC RATING
151st/ 347
METRIC RANK

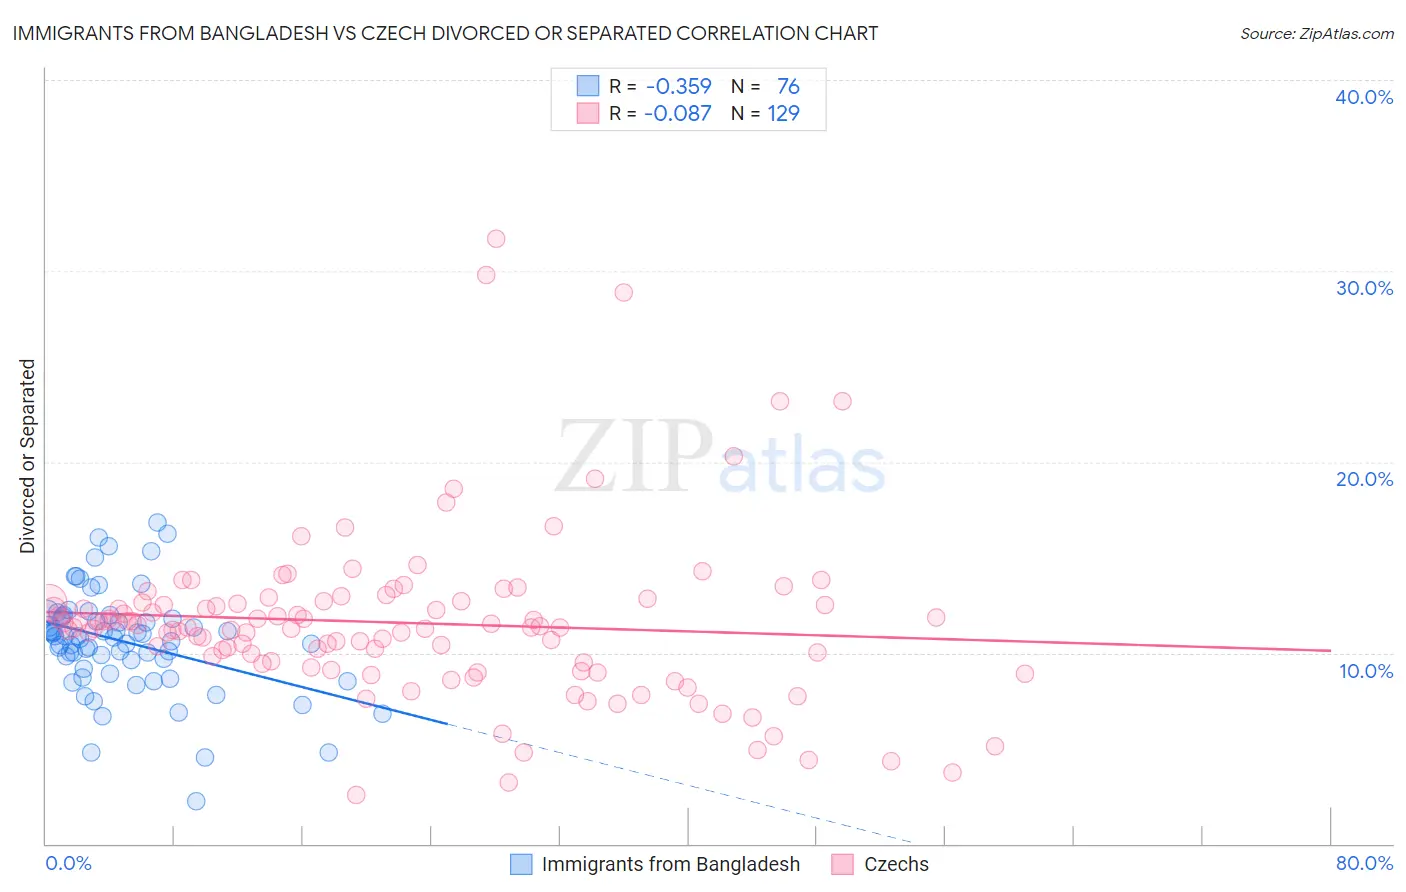
Immigrants from Bangladesh vs Czech Divorced or Separated Correlation Chart

The statistical analysis conducted on geographies consisting of 203,592,218 people shows a mild negative correlation between the proportion of Immigrants from Bangladesh and percentage of population currently divorced or separated in the United States with a correlation coefficient (R) of -0.359 and weighted average of 11.0%. Similarly, the statistical analysis conducted on geographies consisting of 484,565,083 people shows a slight negative correlation between the proportion of Czechs and percentage of population currently divorced or separated in the United States with a correlation coefficient (R) of -0.087 and weighted average of 11.9%, a difference of 8.8%.
Immigrants from Bangladesh vs Czech Divorced or Separated

Divorced or Separated Correlation Summary

MeasurementImmigrants from BangladeshCzech
Minimum2.2%2.5%
Maximum16.8%31.7%
Range14.6%29.2%
Mean10.6%11.6%
Median10.8%11.3%
Interquartile 25% (IQ1)9.4%9.5%
Interquartile 75% (IQ3)11.9%12.7%
Interquartile Range (IQR)2.5%3.2%
Standard Deviation (Sample)2.7%4.4%
Standard Deviation (Population)2.7%4.4%

Similar Demographics by Divorced or Separated

Demographics Similar to Immigrants from Bangladesh by Divorced or Separated

In terms of divorced or separated, the demographic groups most similar to Immigrants from Bangladesh are Immigrants from Malaysia (11.0%, a difference of 0.030%), Armenian (11.0%, a difference of 0.10%), Immigrants from Indonesia (10.9%, a difference of 0.44%), Immigrants from Ireland (11.0%, a difference of 0.62%), and Mongolian (11.1%, a difference of 0.92%).
DemographicsRating | RankDivorced or Separated
Burmese
100.0
/100
|
#20
Exceptional
10.7%
Immigrants | Asia
100.0
/100
|
#21
Exceptional
10.7%
Vietnamese
100.0
/100
|
#22
Exceptional
10.8%
Immigrants | Pakistan
100.0
/100
|
#23
Exceptional
10.8%
Immigrants | Sri Lanka
100.0
/100
|
#24
Exceptional
10.8%
Iranians
100.0
/100
|
#25
Exceptional
10.8%
Immigrants | Indonesia
100.0
/100
|
#26
Exceptional
10.9%
Immigrants | Bangladesh
100.0
/100
|
#27
Exceptional
11.0%
Immigrants | Malaysia
100.0
/100
|
#28
Exceptional
11.0%
Armenians
100.0
/100
|
#29
Exceptional
11.0%
Immigrants | Ireland
100.0
/100
|
#30
Exceptional
11.0%
Mongolians
100.0
/100
|
#31
Exceptional
11.1%
Tongans
100.0
/100
|
#32
Exceptional
11.1%
Egyptians
100.0
/100
|
#33
Exceptional
11.1%
Immigrants | Uzbekistan
100.0
/100
|
#34
Exceptional
11.1%

Demographics Similar to Czechs by Divorced or Separated

In terms of divorced or separated, the demographic groups most similar to Czechs are Immigrants from Portugal (11.9%, a difference of 0.040%), Immigrants from Oceania (11.9%, a difference of 0.060%), Italian (11.9%, a difference of 0.070%), Polish (11.9%, a difference of 0.11%), and Immigrants from Hungary (11.9%, a difference of 0.13%).
DemographicsRating | RankDivorced or Separated
Peruvians
80.9
/100
|
#144
Excellent
11.9%
Croatians
80.6
/100
|
#145
Excellent
11.9%
Immigrants | Grenada
79.1
/100
|
#146
Good
11.9%
Poles
78.6
/100
|
#147
Good
11.9%
Italians
77.8
/100
|
#148
Good
11.9%
Immigrants | Oceania
77.7
/100
|
#149
Good
11.9%
Immigrants | Portugal
77.3
/100
|
#150
Good
11.9%
Czechs
76.4
/100
|
#151
Good
11.9%
Immigrants | Hungary
73.7
/100
|
#152
Good
11.9%
Austrians
72.2
/100
|
#153
Good
12.0%
Chileans
71.3
/100
|
#154
Good
12.0%
Japanese
70.9
/100
|
#155
Good
12.0%
Hungarians
70.3
/100
|
#156
Good
12.0%
Immigrants | Brazil
68.8
/100
|
#157
Good
12.0%
Icelanders
66.0
/100
|
#158
Good
12.0%