Immigrants from Asia vs Laotian Family Households with Children
COMPARE
Immigrants from Asia
Laotian
Family Households with Children
Family Households with Children Comparison
Immigrants from Asia
Laotians
28.8%
FAMILY HOUSEHOLDS WITH CHILDREN
100.0/ 100
METRIC RATING
55th/ 347
METRIC RANK
28.5%
FAMILY HOUSEHOLDS WITH CHILDREN
99.9/ 100
METRIC RATING
74th/ 347
METRIC RANK
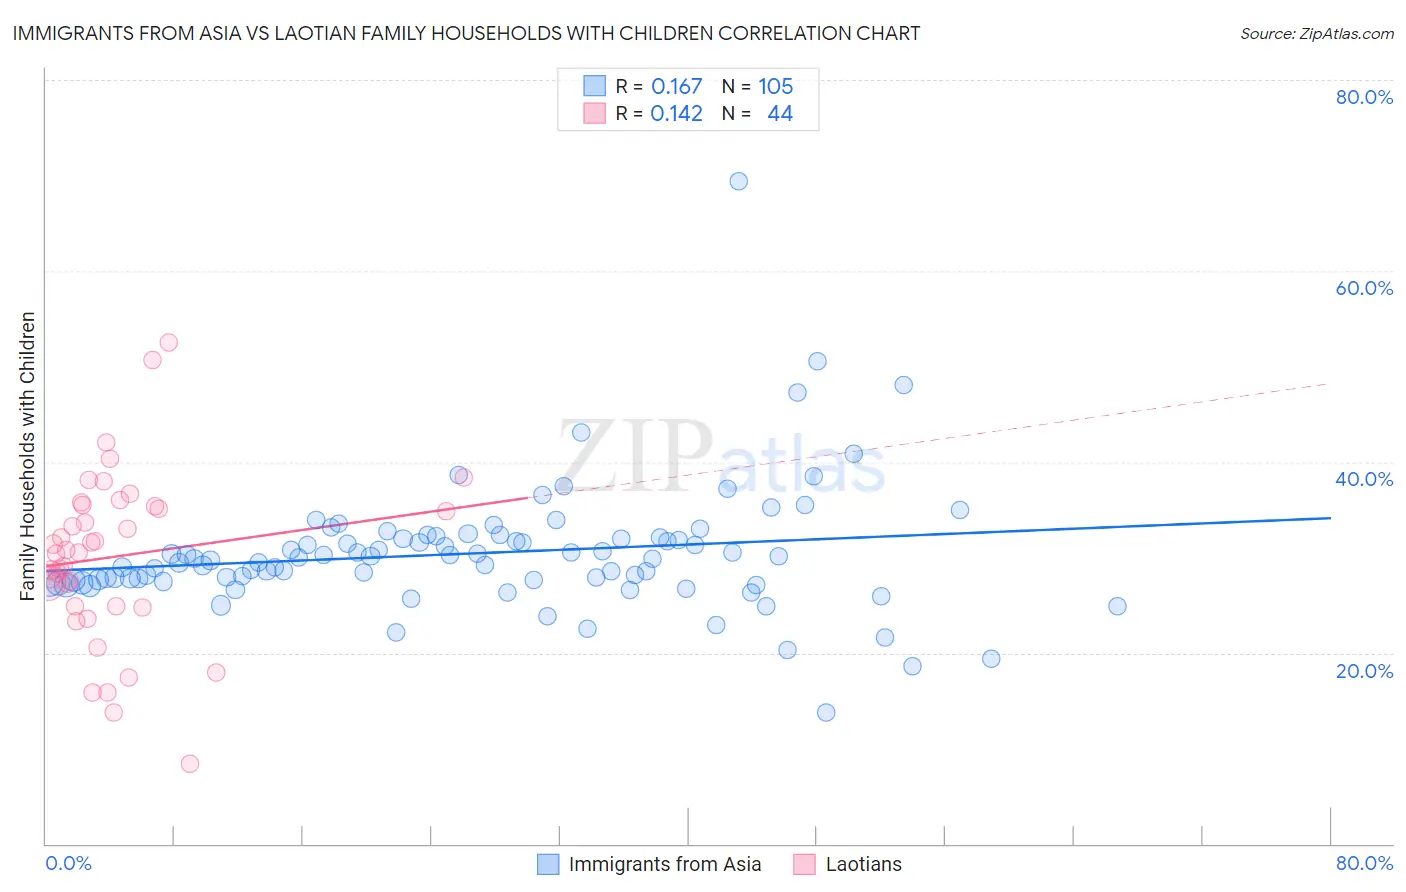
Immigrants from Asia vs Laotian Family Households with Children Correlation Chart
The statistical analysis conducted on geographies consisting of 548,215,399 people shows a poor positive correlation between the proportion of Immigrants from Asia and percentage of family households with children in the United States with a correlation coefficient (R) of 0.167 and weighted average of 28.8%. Similarly, the statistical analysis conducted on geographies consisting of 224,687,368 people shows a poor positive correlation between the proportion of Laotians and percentage of family households with children in the United States with a correlation coefficient (R) of 0.142 and weighted average of 28.5%, a difference of 1.3%.
Family Households with Children Correlation Summary
| Measurement | Immigrants from Asia | Laotian |
| Minimum | 13.7% | 8.4% |
| Maximum | 69.4% | 52.5% |
| Range | 55.7% | 44.2% |
| Mean | 30.4% | 30.1% |
| Median | 29.9% | 30.6% |
| Interquartile 25% (IQ1) | 27.6% | 24.9% |
| Interquartile 75% (IQ3) | 32.0% | 35.4% |
| Interquartile Range (IQR) | 4.5% | 10.5% |
| Standard Deviation (Sample) | 6.6% | 8.9% |
| Standard Deviation (Population) | 6.6% | 8.8% |
Demographics Similar to Immigrants from Asia and Laotians by Family Households with Children
In terms of family households with children, the demographic groups most similar to Immigrants from Asia are Sierra Leonean (28.9%, a difference of 0.060%), Immigrants from Guatemala (28.8%, a difference of 0.070%), Danish (28.7%, a difference of 0.31%), Hawaiian (28.7%, a difference of 0.46%), and Immigrants from Nigeria (28.6%, a difference of 0.79%). Similarly, the demographic groups most similar to Laotians are Iraqi (28.5%, a difference of 0.010%), Immigrants from Indonesia (28.5%, a difference of 0.040%), Burmese (28.5%, a difference of 0.060%), Immigrants from Honduras (28.5%, a difference of 0.070%), and Immigrants from Korea (28.5%, a difference of 0.12%).
| Demographics | Rating | Rank | Family Households with Children |
| Sierra Leoneans | 100.0 /100 | #54 | Exceptional 28.9% |
| Immigrants | Asia | 100.0 /100 | #55 | Exceptional 28.8% |
| Immigrants | Guatemala | 100.0 /100 | #56 | Exceptional 28.8% |
| Danes | 100.0 /100 | #57 | Exceptional 28.7% |
| Hawaiians | 100.0 /100 | #58 | Exceptional 28.7% |
| Immigrants | Nigeria | 100.0 /100 | #59 | Exceptional 28.6% |
| Hmong | 99.9 /100 | #60 | Exceptional 28.6% |
| Immigrants | Ghana | 99.9 /100 | #61 | Exceptional 28.6% |
| Egyptians | 99.9 /100 | #62 | Exceptional 28.6% |
| Immigrants | Lebanon | 99.9 /100 | #63 | Exceptional 28.6% |
| Filipinos | 99.9 /100 | #64 | Exceptional 28.6% |
| Hondurans | 99.9 /100 | #65 | Exceptional 28.5% |
| Immigrants | Egypt | 99.9 /100 | #66 | Exceptional 28.5% |
| Ghanaians | 99.9 /100 | #67 | Exceptional 28.5% |
| Houma | 99.9 /100 | #68 | Exceptional 28.5% |
| Immigrants | Korea | 99.9 /100 | #69 | Exceptional 28.5% |
| Immigrants | Honduras | 99.9 /100 | #70 | Exceptional 28.5% |
| Burmese | 99.9 /100 | #71 | Exceptional 28.5% |
| Immigrants | Indonesia | 99.9 /100 | #72 | Exceptional 28.5% |
| Iraqis | 99.9 /100 | #73 | Exceptional 28.5% |
| Laotians | 99.9 /100 | #74 | Exceptional 28.5% |