Immigrants from Argentina vs Senegalese Average Family Size
COMPARE
Immigrants from Argentina
Senegalese
Average Family Size
Average Family Size Comparison
Immigrants from Argentina
Senegalese
3.22
AVERAGE FAMILY SIZE
39.8/ 100
METRIC RATING
186th/ 347
METRIC RANK
3.21
AVERAGE FAMILY SIZE
28.2/ 100
METRIC RATING
196th/ 347
METRIC RANK
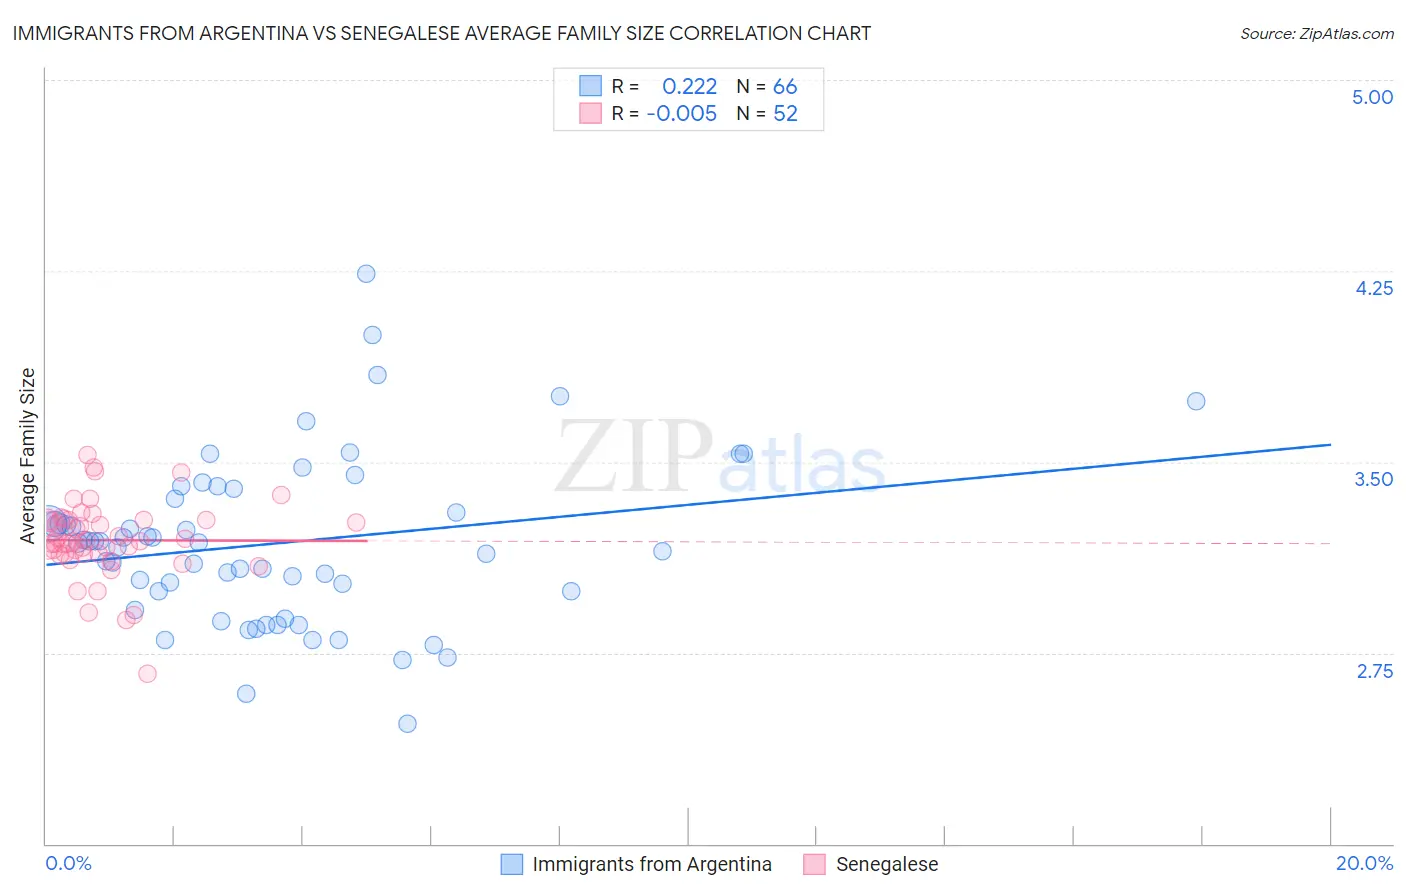
Immigrants from Argentina vs Senegalese Average Family Size Correlation Chart
The statistical analysis conducted on geographies consisting of 264,360,356 people shows a weak positive correlation between the proportion of Immigrants from Argentina and average family size in the United States with a correlation coefficient (R) of 0.222 and weighted average of 3.22. Similarly, the statistical analysis conducted on geographies consisting of 78,113,781 people shows no correlation between the proportion of Senegalese and average family size in the United States with a correlation coefficient (R) of -0.005 and weighted average of 3.21, a difference of 0.24%.
Average Family Size Correlation Summary
| Measurement | Immigrants from Argentina | Senegalese |
| Minimum | 2.47 | 2.67 |
| Maximum | 4.24 | 3.53 |
| Range | 1.77 | 0.86 |
| Mean | 3.18 | 3.19 |
| Median | 3.18 | 3.19 |
| Interquartile 25% (IQ1) | 2.99 | 3.14 |
| Interquartile 75% (IQ3) | 3.36 | 3.27 |
| Interquartile Range (IQR) | 0.37 | 0.13 |
| Standard Deviation (Sample) | 0.33 | 0.15 |
| Standard Deviation (Population) | 0.32 | 0.15 |
Demographics Similar to Immigrants from Argentina and Senegalese by Average Family Size
In terms of average family size, the demographic groups most similar to Immigrants from Argentina are Immigrants from Sri Lanka (3.22, a difference of 0.0%), Immigrants from Eastern Asia (3.22, a difference of 0.020%), Immigrants from Malaysia (3.22, a difference of 0.020%), Thai (3.22, a difference of 0.030%), and Immigrants from Northern Africa (3.22, a difference of 0.040%). Similarly, the demographic groups most similar to Senegalese are Choctaw (3.21, a difference of 0.0%), Kenyan (3.21, a difference of 0.0%), Immigrants from Israel (3.22, a difference of 0.020%), Immigrants from Sudan (3.22, a difference of 0.020%), and Immigrants from Eastern Africa (3.22, a difference of 0.040%).
| Demographics | Rating | Rank | Average Family Size |
| Spanish | 44.8 /100 | #181 | Average 3.23 |
| Moroccans | 44.2 /100 | #182 | Average 3.22 |
| Immigrants | Northern Africa | 41.7 /100 | #183 | Average 3.22 |
| Immigrants | Eastern Asia | 40.8 /100 | #184 | Average 3.22 |
| Immigrants | Sri Lanka | 39.8 /100 | #185 | Fair 3.22 |
| Immigrants | Argentina | 39.8 /100 | #186 | Fair 3.22 |
| Immigrants | Malaysia | 39.0 /100 | #187 | Fair 3.22 |
| Thais | 38.3 /100 | #188 | Fair 3.22 |
| Pakistanis | 33.7 /100 | #189 | Fair 3.22 |
| Burmese | 31.0 /100 | #190 | Fair 3.22 |
| Immigrants | Zaire | 30.5 /100 | #191 | Fair 3.22 |
| Immigrants | Eastern Africa | 30.1 /100 | #192 | Fair 3.22 |
| Immigrants | Israel | 29.3 /100 | #193 | Fair 3.22 |
| Immigrants | Sudan | 29.1 /100 | #194 | Fair 3.22 |
| Choctaw | 28.3 /100 | #195 | Fair 3.21 |
| Senegalese | 28.2 /100 | #196 | Fair 3.21 |
| Kenyans | 28.0 /100 | #197 | Fair 3.21 |
| Immigrants | Azores | 21.7 /100 | #198 | Fair 3.21 |
| Hmong | 20.7 /100 | #199 | Fair 3.21 |
| Immigrants | Kenya | 19.2 /100 | #200 | Poor 3.21 |
| Immigrants | Morocco | 18.5 /100 | #201 | Poor 3.21 |