Immigrants from Albania vs Immigrants from Croatia Family Households with Children
COMPARE
Immigrants from Albania
Immigrants from Croatia
Family Households with Children
Family Households with Children Comparison
Immigrants from Albania
Immigrants from Croatia
25.9%
FAMILY HOUSEHOLDS WITH CHILDREN
0.0/ 100
METRIC RATING
328th/ 347
METRIC RANK
25.7%
FAMILY HOUSEHOLDS WITH CHILDREN
0.0/ 100
METRIC RATING
335th/ 347
METRIC RANK
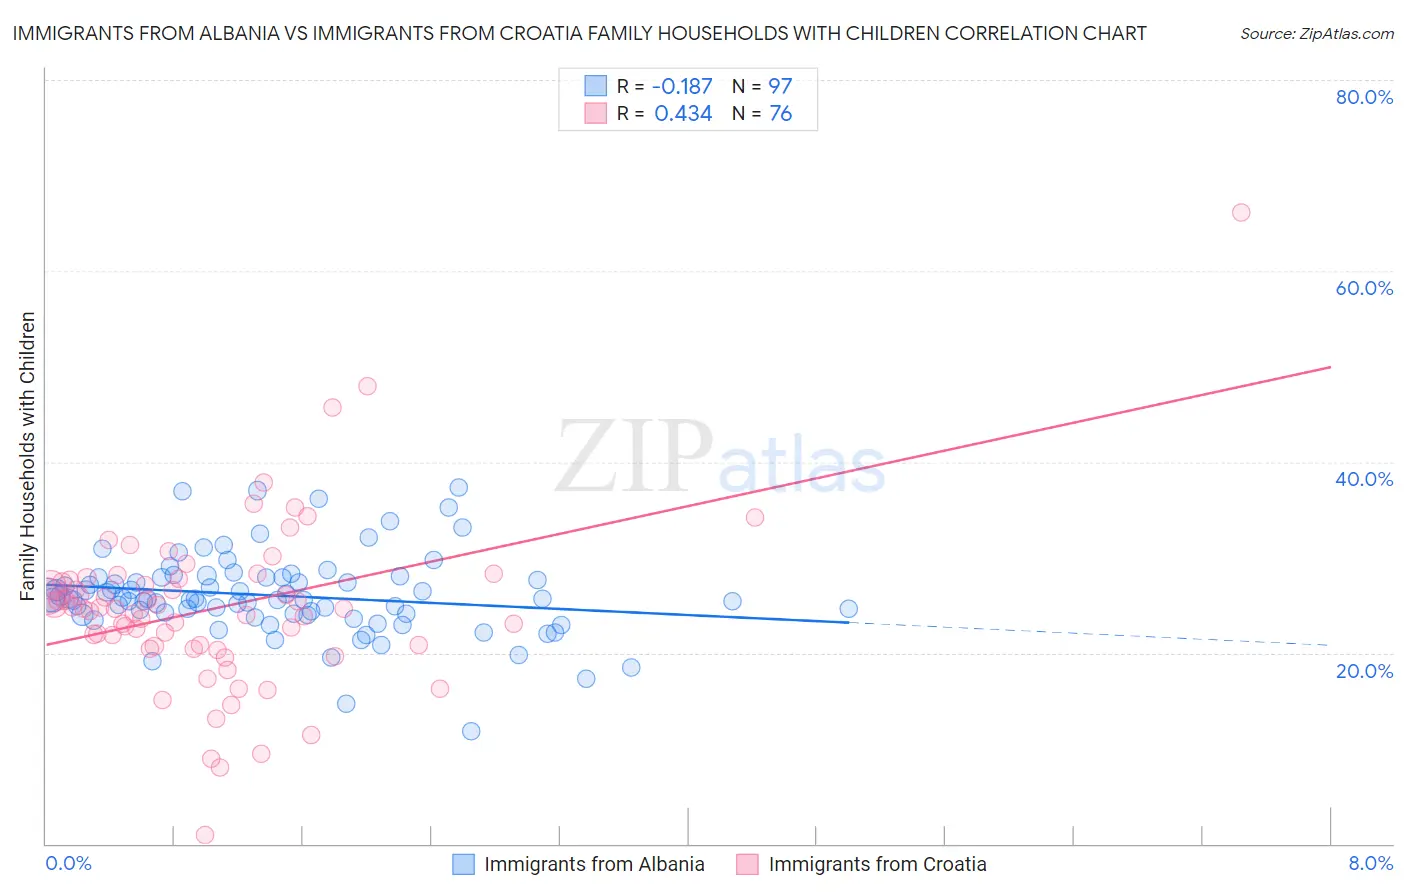
Immigrants from Albania vs Immigrants from Croatia Family Households with Children Correlation Chart
The statistical analysis conducted on geographies consisting of 119,367,194 people shows a poor negative correlation between the proportion of Immigrants from Albania and percentage of family households with children in the United States with a correlation coefficient (R) of -0.187 and weighted average of 25.9%. Similarly, the statistical analysis conducted on geographies consisting of 132,550,122 people shows a moderate positive correlation between the proportion of Immigrants from Croatia and percentage of family households with children in the United States with a correlation coefficient (R) of 0.434 and weighted average of 25.7%, a difference of 0.91%.
Family Households with Children Correlation Summary
| Measurement | Immigrants from Albania | Immigrants from Croatia |
| Minimum | 11.8% | 0.93% |
| Maximum | 37.3% | 66.1% |
| Range | 25.5% | 65.1% |
| Mean | 26.0% | 24.7% |
| Median | 25.6% | 24.6% |
| Interquartile 25% (IQ1) | 24.0% | 20.7% |
| Interquartile 75% (IQ3) | 27.9% | 27.7% |
| Interquartile Range (IQR) | 3.9% | 7.0% |
| Standard Deviation (Sample) | 4.3% | 8.9% |
| Standard Deviation (Population) | 4.3% | 8.9% |
Demographics Similar to Immigrants from Albania and Immigrants from Croatia by Family Households with Children
In terms of family households with children, the demographic groups most similar to Immigrants from Albania are Immigrants from Barbados (26.0%, a difference of 0.10%), Cypriot (25.9%, a difference of 0.13%), Immigrants from Ireland (26.0%, a difference of 0.21%), Barbadian (26.0%, a difference of 0.24%), and Chinese (26.0%, a difference of 0.29%). Similarly, the demographic groups most similar to Immigrants from Croatia are Slovak (25.7%, a difference of 0.010%), Immigrants from West Indies (25.7%, a difference of 0.10%), Immigrants from Switzerland (25.7%, a difference of 0.16%), Immigrants from Austria (25.8%, a difference of 0.24%), and Slovene (25.8%, a difference of 0.47%).
| Demographics | Rating | Rank | Family Households with Children |
| British West Indians | 0.0 /100 | #321 | Tragic 26.0% |
| Immigrants | Greece | 0.0 /100 | #322 | Tragic 26.0% |
| Immigrants | Australia | 0.0 /100 | #323 | Tragic 26.0% |
| Chinese | 0.0 /100 | #324 | Tragic 26.0% |
| Barbadians | 0.0 /100 | #325 | Tragic 26.0% |
| Immigrants | Ireland | 0.0 /100 | #326 | Tragic 26.0% |
| Immigrants | Barbados | 0.0 /100 | #327 | Tragic 26.0% |
| Immigrants | Albania | 0.0 /100 | #328 | Tragic 25.9% |
| Cypriots | 0.0 /100 | #329 | Tragic 25.9% |
| Immigrants | Latvia | 0.0 /100 | #330 | Tragic 25.9% |
| Slovenes | 0.0 /100 | #331 | Tragic 25.8% |
| Immigrants | Austria | 0.0 /100 | #332 | Tragic 25.8% |
| Immigrants | Switzerland | 0.0 /100 | #333 | Tragic 25.7% |
| Slovaks | 0.0 /100 | #334 | Tragic 25.7% |
| Immigrants | Croatia | 0.0 /100 | #335 | Tragic 25.7% |
| Immigrants | West Indies | 0.0 /100 | #336 | Tragic 25.7% |
| Puerto Ricans | 0.0 /100 | #337 | Tragic 25.6% |
| Arapaho | 0.0 /100 | #338 | Tragic 25.6% |
| Immigrants | St. Vincent and the Grenadines | 0.0 /100 | #339 | Tragic 25.6% |
| Immigrants | Armenia | 0.0 /100 | #340 | Tragic 25.6% |
| Immigrants | Serbia | 0.0 /100 | #341 | Tragic 25.5% |