Immigrants from Afghanistan vs Cape Verdean Single Father Households
COMPARE
Immigrants from Afghanistan
Cape Verdean
Single Father Households
Single Father Households Comparison
Immigrants from Afghanistan
Cape Verdeans
2.4%
SINGLE FATHER HOUSEHOLDS
24.2/ 100
METRIC RATING
205th/ 347
METRIC RANK
2.9%
SINGLE FATHER HOUSEHOLDS
0.0/ 100
METRIC RATING
318th/ 347
METRIC RANK
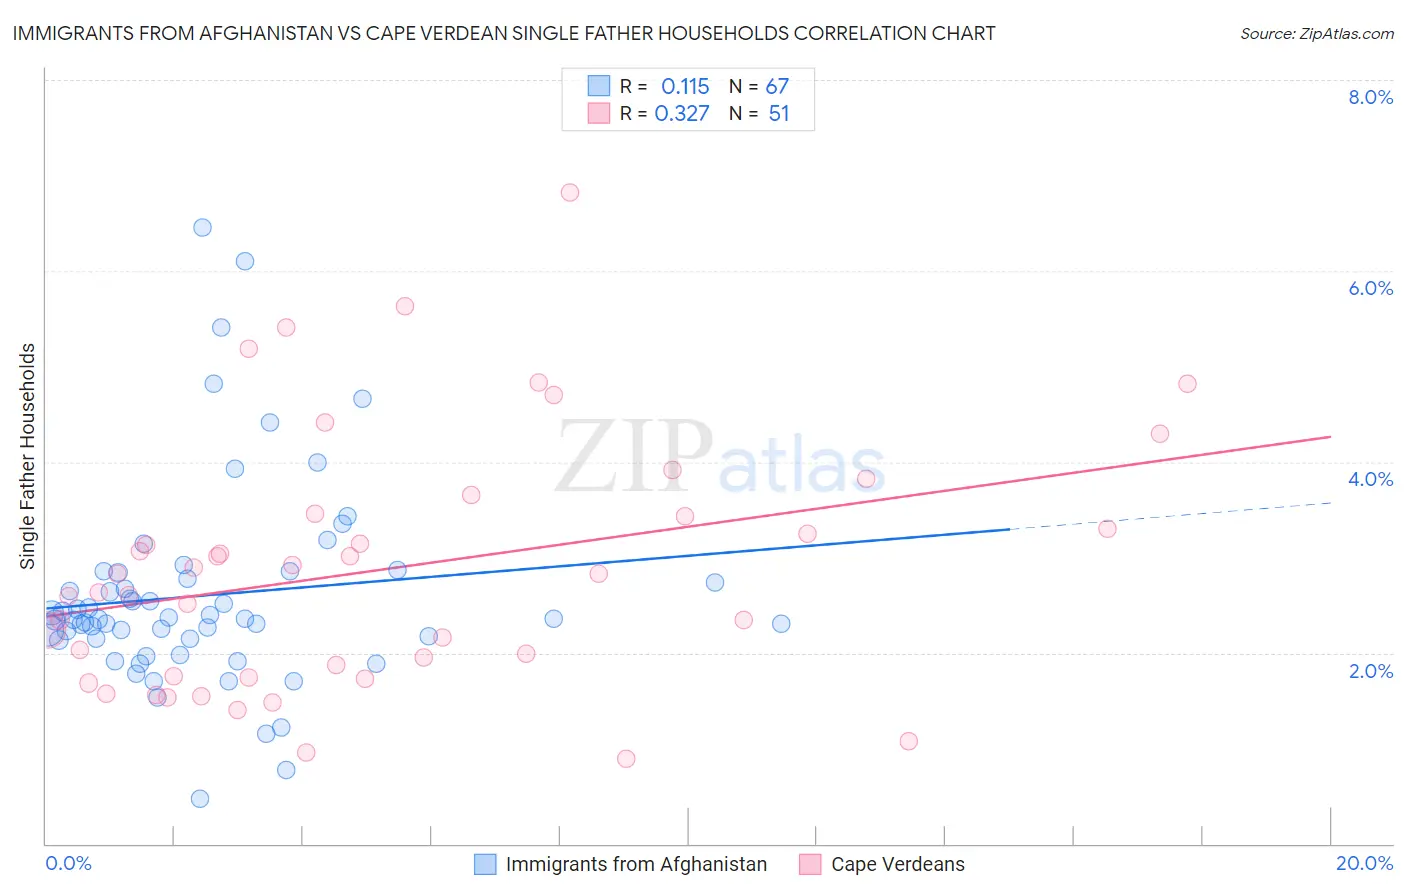
Immigrants from Afghanistan vs Cape Verdean Single Father Households Correlation Chart
The statistical analysis conducted on geographies consisting of 147,265,555 people shows a poor positive correlation between the proportion of Immigrants from Afghanistan and percentage of single father households in the United States with a correlation coefficient (R) of 0.115 and weighted average of 2.4%. Similarly, the statistical analysis conducted on geographies consisting of 107,168,631 people shows a mild positive correlation between the proportion of Cape Verdeans and percentage of single father households in the United States with a correlation coefficient (R) of 0.327 and weighted average of 2.9%, a difference of 23.4%.
Single Father Households Correlation Summary
| Measurement | Immigrants from Afghanistan | Cape Verdean |
| Minimum | 0.48% | 0.90% |
| Maximum | 6.5% | 6.8% |
| Range | 6.0% | 5.9% |
| Mean | 2.6% | 2.9% |
| Median | 2.4% | 2.8% |
| Interquartile 25% (IQ1) | 2.1% | 1.8% |
| Interquartile 75% (IQ3) | 2.8% | 3.5% |
| Interquartile Range (IQR) | 0.70% | 1.7% |
| Standard Deviation (Sample) | 1.1% | 1.3% |
| Standard Deviation (Population) | 1.1% | 1.3% |
Similar Demographics by Single Father Households
Demographics Similar to Immigrants from Afghanistan by Single Father Households
In terms of single father households, the demographic groups most similar to Immigrants from Afghanistan are Korean (2.4%, a difference of 0.0%), Ecuadorian (2.4%, a difference of 0.030%), French Canadian (2.4%, a difference of 0.050%), German Russian (2.4%, a difference of 0.15%), and White/Caucasian (2.4%, a difference of 0.16%).
| Demographics | Rating | Rank | Single Father Households |
| Scandinavians | 27.4 /100 | #198 | Fair 2.4% |
| Immigrants | Vietnam | 27.1 /100 | #199 | Fair 2.4% |
| Peruvians | 27.1 /100 | #200 | Fair 2.4% |
| Immigrants | Uganda | 26.0 /100 | #201 | Fair 2.4% |
| German Russians | 25.7 /100 | #202 | Fair 2.4% |
| French Canadians | 24.7 /100 | #203 | Fair 2.4% |
| Ecuadorians | 24.5 /100 | #204 | Fair 2.4% |
| Immigrants | Afghanistan | 24.2 /100 | #205 | Fair 2.4% |
| Koreans | 24.1 /100 | #206 | Fair 2.4% |
| Whites/Caucasians | 22.6 /100 | #207 | Fair 2.4% |
| Immigrants | Kenya | 20.3 /100 | #208 | Fair 2.4% |
| Immigrants | Peru | 19.3 /100 | #209 | Poor 2.4% |
| Immigrants | Costa Rica | 19.2 /100 | #210 | Poor 2.4% |
| Immigrants | Nigeria | 18.7 /100 | #211 | Poor 2.4% |
| Finns | 18.3 /100 | #212 | Poor 2.4% |
Demographics Similar to Cape Verdeans by Single Father Households
In terms of single father households, the demographic groups most similar to Cape Verdeans are Immigrants from El Salvador (2.9%, a difference of 0.010%), Ute (3.0%, a difference of 0.53%), Guatemalan (3.0%, a difference of 0.61%), Cheyenne (2.9%, a difference of 0.87%), and Houma (2.9%, a difference of 0.87%).
| Demographics | Rating | Rank | Single Father Households |
| Spanish American Indians | 0.0 /100 | #311 | Tragic 2.9% |
| Tsimshian | 0.0 /100 | #312 | Tragic 2.9% |
| Arapaho | 0.0 /100 | #313 | Tragic 2.9% |
| Salvadorans | 0.0 /100 | #314 | Tragic 2.9% |
| Cheyenne | 0.0 /100 | #315 | Tragic 2.9% |
| Houma | 0.0 /100 | #316 | Tragic 2.9% |
| Immigrants | El Salvador | 0.0 /100 | #317 | Tragic 2.9% |
| Cape Verdeans | 0.0 /100 | #318 | Tragic 2.9% |
| Ute | 0.0 /100 | #319 | Tragic 3.0% |
| Guatemalans | 0.0 /100 | #320 | Tragic 3.0% |
| Mexicans | 0.0 /100 | #321 | Tragic 3.0% |
| Immigrants | Guatemala | 0.0 /100 | #322 | Tragic 3.0% |
| Immigrants | Central America | 0.0 /100 | #323 | Tragic 3.0% |
| Fijians | 0.0 /100 | #324 | Tragic 3.0% |
| Immigrants | Mexico | 0.0 /100 | #325 | Tragic 3.0% |