German vs Immigrants from Denmark Family Households
COMPARE
German
Immigrants from Denmark
Family Households
Family Households Comparison
Germans
Immigrants from Denmark
64.4%
FAMILY HOUSEHOLDS
65.8/ 100
METRIC RATING
159th/ 347
METRIC RANK
62.9%
FAMILY HOUSEHOLDS
0.1/ 100
METRIC RATING
283rd/ 347
METRIC RANK
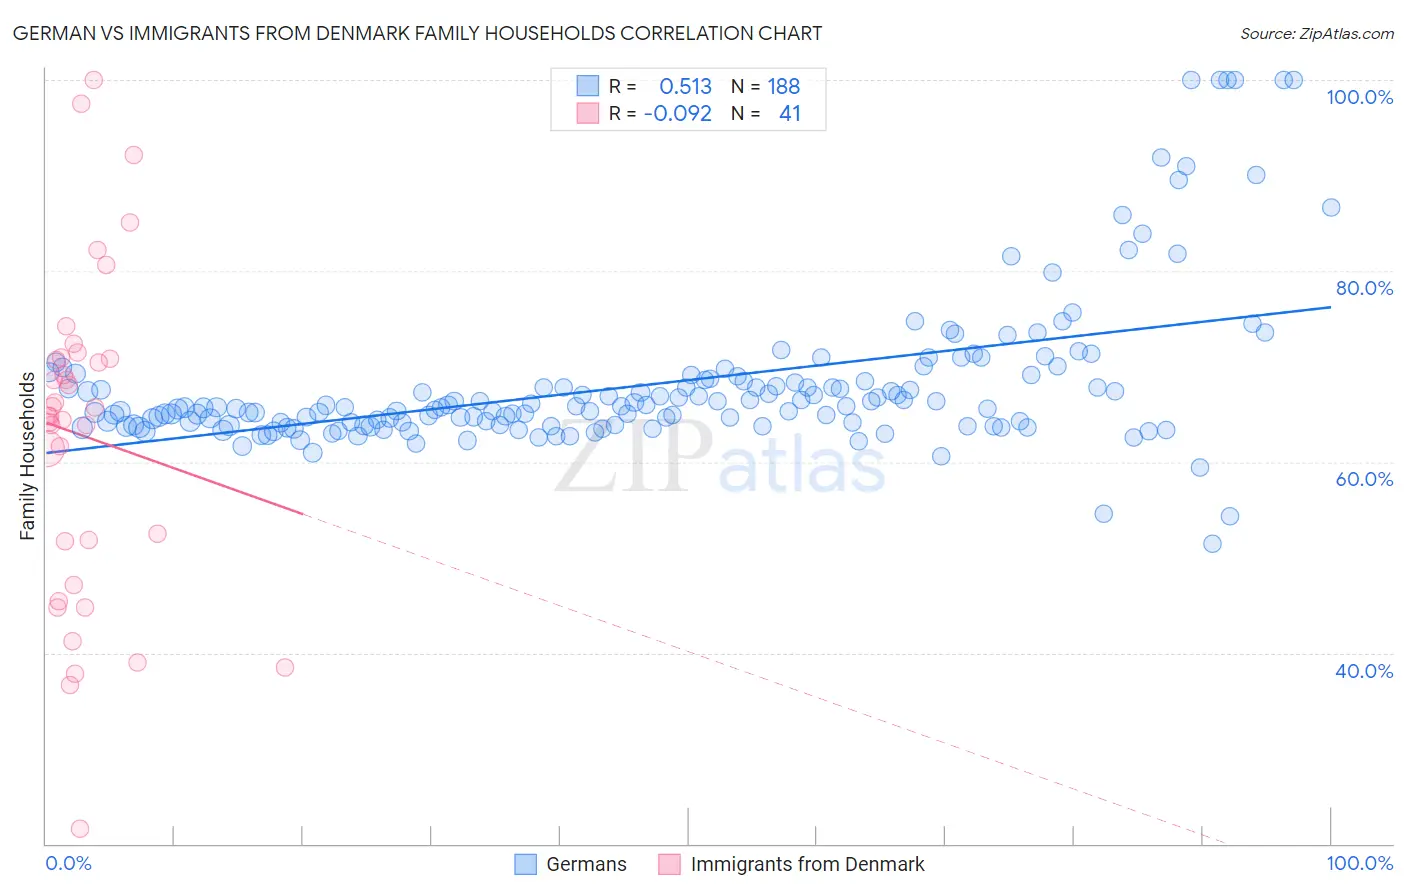
German vs Immigrants from Denmark Family Households Correlation Chart
The statistical analysis conducted on geographies consisting of 580,609,417 people shows a substantial positive correlation between the proportion of Germans and percentage of family households in the United States with a correlation coefficient (R) of 0.513 and weighted average of 64.4%. Similarly, the statistical analysis conducted on geographies consisting of 136,405,039 people shows a slight negative correlation between the proportion of Immigrants from Denmark and percentage of family households in the United States with a correlation coefficient (R) of -0.092 and weighted average of 62.9%, a difference of 2.5%.
Family Households Correlation Summary
| Measurement | German | Immigrants from Denmark |
| Minimum | 51.4% | 21.6% |
| Maximum | 100.0% | 100.0% |
| Range | 48.6% | 78.4% |
| Mean | 68.1% | 62.7% |
| Median | 65.7% | 64.8% |
| Interquartile 25% (IQ1) | 63.9% | 49.4% |
| Interquartile 75% (IQ3) | 68.5% | 70.9% |
| Interquartile Range (IQR) | 4.7% | 21.5% |
| Standard Deviation (Sample) | 8.2% | 17.0% |
| Standard Deviation (Population) | 8.2% | 16.8% |
Similar Demographics by Family Households
Demographics Similar to Germans by Family Households
In terms of family households, the demographic groups most similar to Germans are Canadian (64.4%, a difference of 0.010%), Lebanese (64.4%, a difference of 0.010%), Immigrants from Moldova (64.4%, a difference of 0.010%), Czech (64.5%, a difference of 0.020%), and Uruguayan (64.5%, a difference of 0.030%).
| Demographics | Rating | Rank | Family Households |
| Scottish | 70.9 /100 | #152 | Good 64.5% |
| Swedes | 69.8 /100 | #153 | Good 64.5% |
| Austrians | 68.5 /100 | #154 | Good 64.5% |
| Uruguayans | 67.7 /100 | #155 | Good 64.5% |
| Czechs | 67.0 /100 | #156 | Good 64.5% |
| Canadians | 66.6 /100 | #157 | Good 64.4% |
| Lebanese | 66.4 /100 | #158 | Good 64.4% |
| Germans | 65.8 /100 | #159 | Good 64.4% |
| Immigrants | Moldova | 65.2 /100 | #160 | Good 64.4% |
| Immigrants | England | 62.6 /100 | #161 | Good 64.4% |
| British | 61.6 /100 | #162 | Good 64.4% |
| Chickasaw | 61.5 /100 | #163 | Good 64.4% |
| Immigrants | Nigeria | 60.1 /100 | #164 | Good 64.4% |
| Immigrants | Southern Europe | 60.0 /100 | #165 | Good 64.4% |
| Scotch-Irish | 59.2 /100 | #166 | Average 64.4% |
Demographics Similar to Immigrants from Denmark by Family Households
In terms of family households, the demographic groups most similar to Immigrants from Denmark are New Zealander (62.9%, a difference of 0.010%), Estonian (62.9%, a difference of 0.040%), Australian (62.8%, a difference of 0.040%), Immigrants from Bulgaria (63.0%, a difference of 0.13%), and Immigrants from Yemen (63.0%, a difference of 0.15%).
| Demographics | Rating | Rank | Family Households |
| Serbians | 0.3 /100 | #276 | Tragic 63.0% |
| Ottawa | 0.3 /100 | #277 | Tragic 63.0% |
| Immigrants | Belgium | 0.2 /100 | #278 | Tragic 63.0% |
| Immigrants | Yemen | 0.2 /100 | #279 | Tragic 63.0% |
| Immigrants | Bulgaria | 0.2 /100 | #280 | Tragic 63.0% |
| Estonians | 0.2 /100 | #281 | Tragic 62.9% |
| New Zealanders | 0.1 /100 | #282 | Tragic 62.9% |
| Immigrants | Denmark | 0.1 /100 | #283 | Tragic 62.9% |
| Australians | 0.1 /100 | #284 | Tragic 62.8% |
| Mongolians | 0.1 /100 | #285 | Tragic 62.8% |
| British West Indians | 0.1 /100 | #286 | Tragic 62.8% |
| Latvians | 0.1 /100 | #287 | Tragic 62.8% |
| Immigrants | Uganda | 0.1 /100 | #288 | Tragic 62.7% |
| Immigrants | Nepal | 0.1 /100 | #289 | Tragic 62.7% |
| Immigrants | Grenada | 0.0 /100 | #290 | Tragic 62.6% |