French vs Immigrants from Eritrea Currently Married

COMPARE

French
Race
Ancestry
AfghanAfricanAlaska NativeAlaskan AthabascanAlbanianAleutAlsatianAmericanApacheArabArapahoArgentineanArmenianAssyrian/Chaldean/SyriacAustralianAustrianBahamianBangladeshiBarbadianBasqueBelgianBelizeanBermudanBhutaneseBlackfeetBolivianBrazilianBritishBritish West IndianBulgarianBurmeseCajunCambodianCanadianCape VerdeanCarpatho RusynCelticCentral AmericanCentral American IndianCherokeeCheyenneChickasawChileanChineseChippewaChoctawColombianColvilleComancheCosta RicanCreeCreekCroatianCrowCubanCypriotCzechCzechoslovakianDanishDelawareDominicanDutchDutch West IndianEastern EuropeanEcuadorianEgyptianEnglishEstonianEthiopianEuropeanFijianFilipinoFinnishFrenchFrench American IndianFrench CanadianGermanGerman RussianGhanaianGreekGuamanian/ChamorroGuatemalanGuyaneseHaitianHmongHonduranHopiHoumaHungarianIcelanderIndian (Asian)IndonesianInupiatIranianIraqiIrishIroquoisIsraeliItalianJamaicanJapaneseJordanianKenyanKiowaKoreanLaotianLatvianLebaneseLiberianLithuanianLumbeeLuxembourgerMacedonianMalaysianMalteseMarshalleseMenomineeMexicanMexican American IndianMongolianMoroccanNative HawaiianNavajoNepaleseNew ZealanderNicaraguanNigerianNorthern EuropeanNorwegianOkinawanOsageOttawaPaiutePakistaniPalestinianPanamanianParaguayanPennsylvania GermanPeruvianPimaPolishPortuguesePotawatomiPuebloPuerto RicanPuget Sound SalishRomanianRussianSalvadoranSamoanScandinavianScotch-IrishScottishSeminoleSenegaleseSerbianShoshoneSierra LeoneanSiouxSlavicSlovakSloveneSomaliSouth AfricanSouth AmericanSouth American IndianSoviet UnionSpaniardSpanishSpanish AmericanSpanish American IndianSri LankanSubsaharan AfricanSudaneseSwedishSwissSyrianTaiwaneseThaiTlingit-HaidaTohono O'OdhamTonganTrinidadian and TobagonianTsimshianTurkishU.S. Virgin IslanderUgandanUkrainianUruguayanUteVenezuelanVietnameseWelshWest IndianYakamaYaquiYugoslavianYumanYup'ikZimbabwean
Immigration
NonimmigrantsImmigrantsAfghanistanAfricaAlbaniaArgentinaArmeniaAsiaAustraliaAustriaBahamasBangladeshBarbadosBelarusBelgiumBelizeBoliviaBosnia and HerzegovinaBrazilBulgariaBurma/MyanmarCabo VerdeCambodiaCameroonCanadaCaribbeanCentral AmericaChileChinaColombiaCongoCosta RicaCroatiaCubaCzechoslovakiaDenmarkDominicaDominican RepublicEastern AfricaEastern AsiaEastern EuropeEcuadorEgyptEl SalvadorEnglandEthiopiaEuropeFijiFranceGermanyGhanaGreeceGrenadaGuatemalaGuyanaHaitiHondurasHong KongHungaryIndiaIndonesiaIranIraqIrelandIsraelItalyJamaicaJapanJordanKazakhstanKenyaKoreaKuwaitLaosLatin AmericaLatviaLebanonLiberiaLithuaniaMalaysiaMexicoMicronesiaMiddle AfricaMoldovaMoroccoNepalNetherlandsNicaraguaNigeriaNorth AmericaNorth MacedoniaNorthern AfricaNorthern EuropeNorwayOceaniaPakistanPanamaPeruPhilippinesPolandPortugalRomaniaRussiaSaudi ArabiaScotlandSenegalSerbiaSierra LeoneSingaporeSomaliaSouth AfricaSouth AmericaSouth Central AsiaSouth Eastern AsiaSouthern EuropeSpainSri LankaSt. Vincent and the GrenadinesSudanSwedenSwitzerlandSyriaTaiwanThailandTrinidad and TobagoTurkeyUgandaUkraineUruguayUzbekistanVenezuelaVietnamWest IndiesWestern AfricaWestern AsiaWestern EuropeYemenZaireZimbabweAzores
Immigrants from Eritrea
Race
Ancestry
AfghanAfricanAlaska NativeAlaskan AthabascanAlbanianAleutAlsatianAmericanApacheArabArapahoArgentineanArmenianAssyrian/Chaldean/SyriacAustralianAustrianBahamianBangladeshiBarbadianBasqueBelgianBelizeanBermudanBhutaneseBlackfeetBolivianBrazilianBritishBritish West IndianBulgarianBurmeseCajunCambodianCanadianCape VerdeanCarpatho RusynCelticCentral AmericanCentral American IndianCherokeeCheyenneChickasawChileanChineseChippewaChoctawColombianColvilleComancheCosta RicanCreeCreekCroatianCrowCubanCypriotCzechCzechoslovakianDanishDelawareDominicanDutchDutch West IndianEastern EuropeanEcuadorianEgyptianEnglishEstonianEthiopianEuropeanFijianFilipinoFinnishFrench American IndianFrench CanadianGermanGerman RussianGhanaianGreekGuamanian/ChamorroGuatemalanGuyaneseHaitianHmongHonduranHopiHoumaHungarianIcelanderIndian (Asian)IndonesianInupiatIranianIraqiIrishIroquoisIsraeliItalianJamaicanJapaneseJordanianKenyanKiowaKoreanLaotianLatvianLebaneseLiberianLithuanianLumbeeLuxembourgerMacedonianMalaysianMalteseMarshalleseMenomineeMexicanMexican American IndianMongolianMoroccanNative HawaiianNavajoNepaleseNew ZealanderNicaraguanNigerianNorthern EuropeanNorwegianOkinawanOsageOttawaPaiutePakistaniPalestinianPanamanianParaguayanPennsylvania GermanPeruvianPimaPolishPortuguesePotawatomiPuebloPuerto RicanPuget Sound SalishRomanianRussianSalvadoranSamoanScandinavianScotch-IrishScottishSeminoleSenegaleseSerbianShoshoneSierra LeoneanSiouxSlavicSlovakSloveneSomaliSouth AfricanSouth AmericanSouth American IndianSoviet UnionSpaniardSpanishSpanish AmericanSpanish American IndianSri LankanSubsaharan AfricanSudaneseSwedishSwissSyrianTaiwaneseThaiTlingit-HaidaTohono O'OdhamTonganTrinidadian and TobagonianTsimshianTurkishU.S. Virgin IslanderUgandanUkrainianUruguayanUteVenezuelanVietnameseWelshWest IndianYakamaYaquiYugoslavianYumanYup'ikZimbabwean
Immigration
NonimmigrantsImmigrantsAfghanistanAfricaAlbaniaArgentinaArmeniaAsiaAustraliaAustriaBahamasBangladeshBarbadosBelarusBelgiumBelizeBoliviaBosnia and HerzegovinaBrazilBulgariaBurma/MyanmarCabo VerdeCambodiaCameroonCanadaCaribbeanCentral AmericaChileChinaColombiaCongoCosta RicaCroatiaCubaCzechoslovakiaDenmarkDominicaDominican RepublicEastern AfricaEastern AsiaEastern EuropeEcuadorEgyptEl SalvadorEnglandEritreaEthiopiaEuropeFijiFranceGermanyGhanaGreeceGrenadaGuatemalaGuyanaHaitiHondurasHong KongHungaryIndiaIndonesiaIranIraqIrelandIsraelItalyJamaicaJapanJordanKazakhstanKenyaKoreaKuwaitLaosLatin AmericaLatviaLebanonLiberiaLithuaniaMalaysiaMexicoMicronesiaMiddle AfricaMoldovaMoroccoNepalNetherlandsNicaraguaNigeriaNorth AmericaNorth MacedoniaNorthern AfricaNorthern EuropeNorwayOceaniaPakistanPanamaPeruPhilippinesPolandPortugalRomaniaRussiaSaudi ArabiaScotlandSenegalSerbiaSierra LeoneSingaporeSomaliaSouth AfricaSouth AmericaSouth Central AsiaSouth Eastern AsiaSouthern EuropeSpainSri LankaSt. Vincent and the GrenadinesSudanSwedenSwitzerlandSyriaTaiwanThailandTrinidad and TobagoTurkeyUgandaUkraineUruguayUzbekistanVenezuelaVietnamWest IndiesWestern AfricaWestern AsiaWestern EuropeYemenZaireZimbabweAzores
Currently Married
Income
Poverty
Unemployment
Labor Participation
Family Structure
Vehicle Availability
Education Level
Disability

Currently Married Comparison

French

Immigrants from Eritrea

Exceptional
Tragic
48.4%
CURRENTLY MARRIED
98.6/ 100
METRIC RATING
58th/ 347
METRIC RANK
43.6%
CURRENTLY MARRIED
0.1/ 100
METRIC RATING
267th/ 347
METRIC RANK

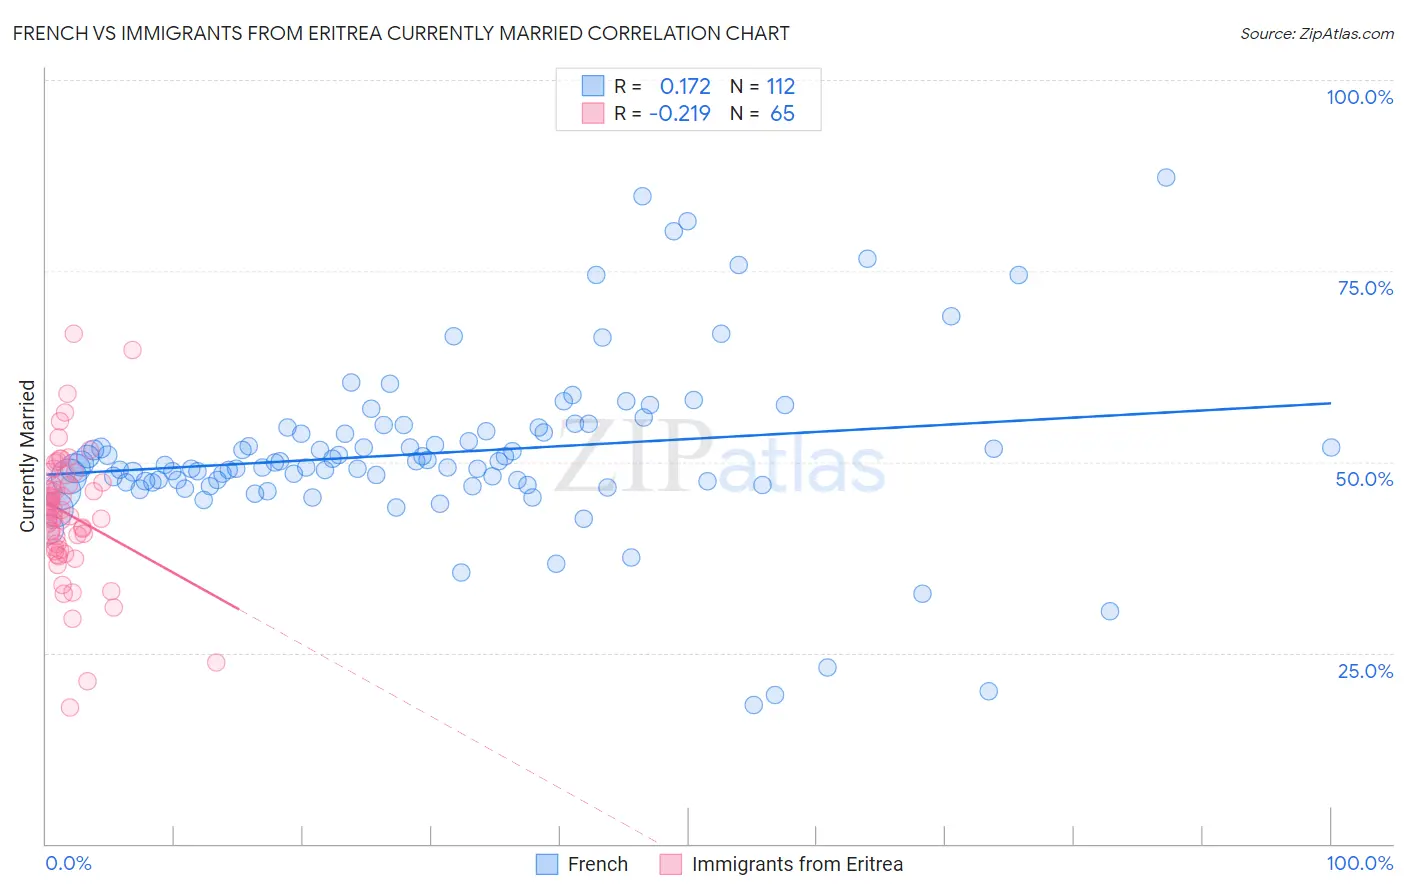
French vs Immigrants from Eritrea Currently Married Correlation Chart

The statistical analysis conducted on geographies consisting of 572,298,467 people shows a poor positive correlation between the proportion of French and percentage of population currently married in the United States with a correlation coefficient (R) of 0.172 and weighted average of 48.4%. Similarly, the statistical analysis conducted on geographies consisting of 104,847,164 people shows a weak negative correlation between the proportion of Immigrants from Eritrea and percentage of population currently married in the United States with a correlation coefficient (R) of -0.219 and weighted average of 43.6%, a difference of 11.1%.
French vs Immigrants from Eritrea Currently Married

Currently Married Correlation Summary

MeasurementFrenchImmigrants from Eritrea
Minimum18.1%17.9%
Maximum87.2%66.7%
Range69.1%48.8%
Mean51.2%43.2%
Median49.6%43.6%
Interquartile 25% (IQ1)47.3%38.6%
Interquartile 75% (IQ3)54.2%47.8%
Interquartile Range (IQR)6.9%9.2%
Standard Deviation (Sample)11.4%8.6%
Standard Deviation (Population)11.3%8.6%

Similar Demographics by Currently Married

Demographics Similar to French by Currently Married

In terms of currently married, the demographic groups most similar to French are Immigrants from Ireland (48.4%, a difference of 0.030%), Immigrants from Netherlands (48.5%, a difference of 0.040%), Immigrants from Romania (48.4%, a difference of 0.040%), Romanian (48.4%, a difference of 0.050%), and Asian (48.4%, a difference of 0.060%).
DemographicsRating | RankCurrently Married
Whites/Caucasians
99.0
/100
|
#51
Exceptional
48.6%
Russians
98.9
/100
|
#52
Exceptional
48.6%
Immigrants | Austria
98.8
/100
|
#53
Exceptional
48.5%
Immigrants | Moldova
98.7
/100
|
#54
Exceptional
48.5%
Immigrants | North Macedonia
98.7
/100
|
#55
Exceptional
48.5%
Latvians
98.7
/100
|
#56
Exceptional
48.5%
Immigrants | Netherlands
98.6
/100
|
#57
Exceptional
48.5%
French
98.6
/100
|
#58
Exceptional
48.4%
Immigrants | Ireland
98.5
/100
|
#59
Exceptional
48.4%
Immigrants | Romania
98.5
/100
|
#60
Exceptional
48.4%
Romanians
98.5
/100
|
#61
Exceptional
48.4%
Asians
98.5
/100
|
#62
Exceptional
48.4%
Slavs
98.3
/100
|
#63
Exceptional
48.4%
Immigrants | Czechoslovakia
98.3
/100
|
#64
Exceptional
48.4%
Ukrainians
98.3
/100
|
#65
Exceptional
48.4%

Demographics Similar to Immigrants from Eritrea by Currently Married

In terms of currently married, the demographic groups most similar to Immigrants from Eritrea are Spanish American Indian (43.6%, a difference of 0.0%), Ecuadorian (43.6%, a difference of 0.030%), Immigrants from Bangladesh (43.6%, a difference of 0.10%), Immigrants from Sudan (43.5%, a difference of 0.13%), and Sudanese (43.7%, a difference of 0.18%).
DemographicsRating | RankCurrently Married
Immigrants | Latin America
0.1
/100
|
#260
Tragic
43.8%
Immigrants | Nicaragua
0.1
/100
|
#261
Tragic
43.7%
Bangladeshis
0.1
/100
|
#262
Tragic
43.7%
Immigrants | Cuba
0.1
/100
|
#263
Tragic
43.7%
Sudanese
0.1
/100
|
#264
Tragic
43.7%
Immigrants | Bangladesh
0.1
/100
|
#265
Tragic
43.6%
Ecuadorians
0.1
/100
|
#266
Tragic
43.6%
Immigrants | Eritrea
0.1
/100
|
#267
Tragic
43.6%
Spanish American Indians
0.1
/100
|
#268
Tragic
43.6%
Immigrants | Sudan
0.1
/100
|
#269
Tragic
43.5%
Salvadorans
0.1
/100
|
#270
Tragic
43.5%
Bermudans
0.1
/100
|
#271
Tragic
43.5%
Indonesians
0.1
/100
|
#272
Tragic
43.5%
Yaqui
0.1
/100
|
#273
Tragic
43.4%
Nigerians
0.1
/100
|
#274
Tragic
43.4%