Finnish vs Haitian Family Households
COMPARE
Finnish
Haitian
Family Households
Family Households Comparison
Finns
Haitians
63.5%
FAMILY HOUSEHOLDS
2.3/ 100
METRIC RATING
234th/ 347
METRIC RANK
65.2%
FAMILY HOUSEHOLDS
98.1/ 100
METRIC RATING
100th/ 347
METRIC RANK
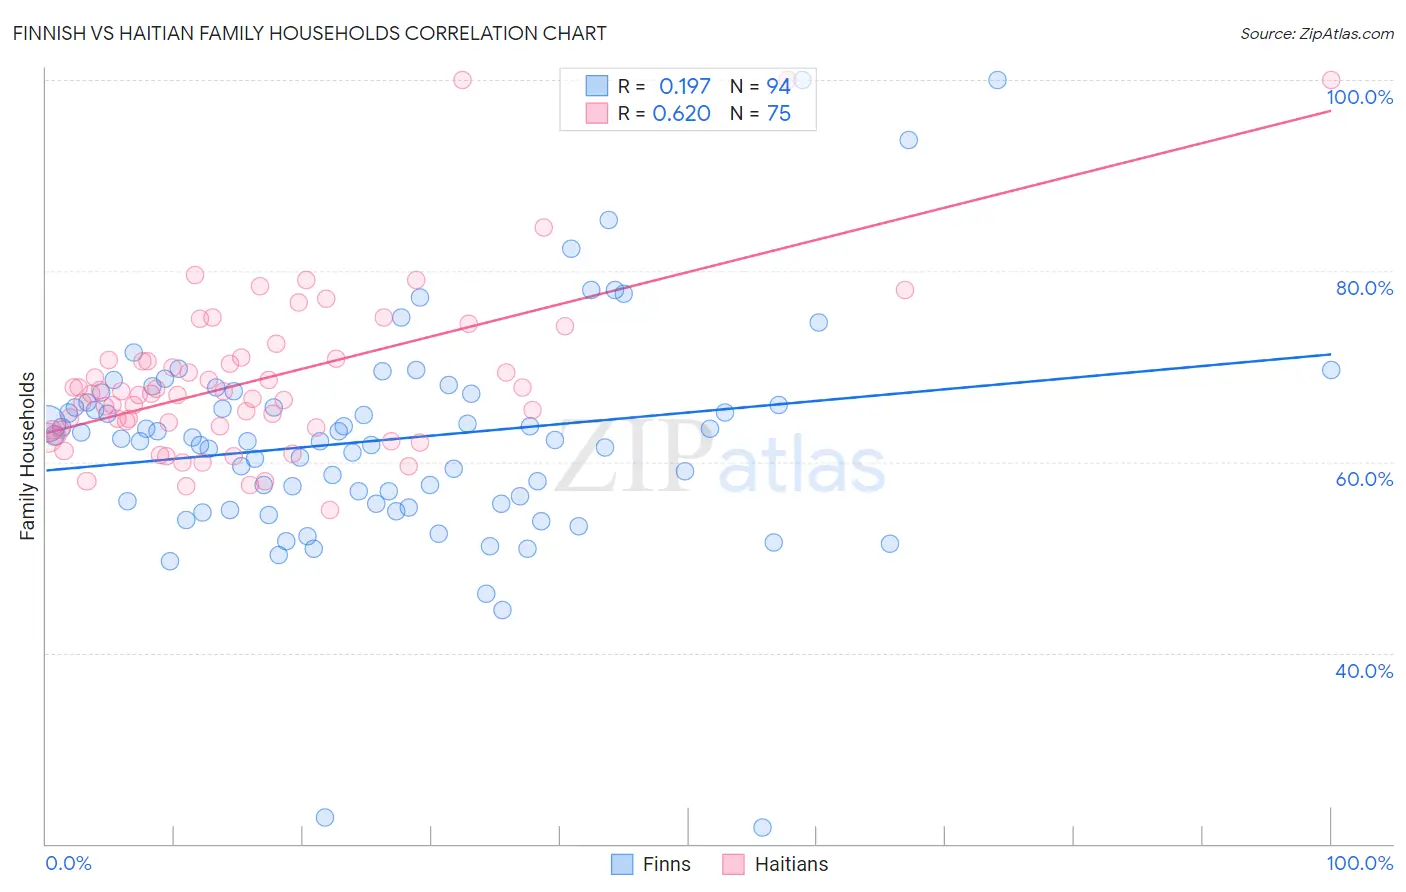
Finnish vs Haitian Family Households Correlation Chart
The statistical analysis conducted on geographies consisting of 404,508,203 people shows a poor positive correlation between the proportion of Finns and percentage of family households in the United States with a correlation coefficient (R) of 0.197 and weighted average of 63.5%. Similarly, the statistical analysis conducted on geographies consisting of 287,715,427 people shows a significant positive correlation between the proportion of Haitians and percentage of family households in the United States with a correlation coefficient (R) of 0.620 and weighted average of 65.2%, a difference of 2.6%.
Family Households Correlation Summary
| Measurement | Finnish | Haitian |
| Minimum | 21.6% | 55.0% |
| Maximum | 100.0% | 100.0% |
| Range | 78.4% | 45.0% |
| Mean | 62.3% | 68.6% |
| Median | 62.4% | 67.1% |
| Interquartile 25% (IQ1) | 55.6% | 63.4% |
| Interquartile 75% (IQ3) | 67.1% | 70.8% |
| Interquartile Range (IQR) | 11.5% | 7.4% |
| Standard Deviation (Sample) | 11.6% | 8.8% |
| Standard Deviation (Population) | 11.6% | 8.7% |
Similar Demographics by Family Households
Demographics Similar to Finns by Family Households
In terms of family households, the demographic groups most similar to Finns are Immigrants from Armenia (63.5%, a difference of 0.030%), Albanian (63.5%, a difference of 0.030%), Immigrants from Northern Africa (63.5%, a difference of 0.040%), Ghanaian (63.5%, a difference of 0.040%), and Comanche (63.5%, a difference of 0.040%).
| Demographics | Rating | Rank | Family Households |
| Trinidadians and Tobagonians | 4.1 /100 | #227 | Tragic 63.6% |
| Blackfeet | 3.6 /100 | #228 | Tragic 63.6% |
| Bulgarians | 3.4 /100 | #229 | Tragic 63.6% |
| Immigrants | Brazil | 3.0 /100 | #230 | Tragic 63.6% |
| Immigrants | Greece | 2.9 /100 | #231 | Tragic 63.5% |
| Immigrants | Northern Africa | 2.6 /100 | #232 | Tragic 63.5% |
| Immigrants | Armenia | 2.6 /100 | #233 | Tragic 63.5% |
| Finns | 2.3 /100 | #234 | Tragic 63.5% |
| Albanians | 2.2 /100 | #235 | Tragic 63.5% |
| Ghanaians | 2.1 /100 | #236 | Tragic 63.5% |
| Comanche | 2.1 /100 | #237 | Tragic 63.5% |
| Immigrants | Zimbabwe | 2.0 /100 | #238 | Tragic 63.5% |
| Aleuts | 1.9 /100 | #239 | Tragic 63.4% |
| South Africans | 1.9 /100 | #240 | Tragic 63.4% |
| Immigrants | St. Vincent and the Grenadines | 1.9 /100 | #241 | Tragic 63.4% |
Demographics Similar to Haitians by Family Households
In terms of family households, the demographic groups most similar to Haitians are Chilean (65.2%, a difference of 0.0%), Immigrants from Sri Lanka (65.1%, a difference of 0.020%), Central American Indian (65.2%, a difference of 0.040%), Indian (Asian) (65.1%, a difference of 0.040%), and Spaniard (65.1%, a difference of 0.040%).
| Demographics | Rating | Rank | Family Households |
| Guyanese | 98.8 /100 | #93 | Exceptional 65.3% |
| Immigrants | Poland | 98.7 /100 | #94 | Exceptional 65.2% |
| Immigrants | Portugal | 98.6 /100 | #95 | Exceptional 65.2% |
| Swiss | 98.6 /100 | #96 | Exceptional 65.2% |
| Guatemalans | 98.6 /100 | #97 | Exceptional 65.2% |
| Immigrants | Syria | 98.4 /100 | #98 | Exceptional 65.2% |
| Central American Indians | 98.3 /100 | #99 | Exceptional 65.2% |
| Haitians | 98.1 /100 | #100 | Exceptional 65.2% |
| Chileans | 98.1 /100 | #101 | Exceptional 65.2% |
| Immigrants | Sri Lanka | 98.0 /100 | #102 | Exceptional 65.1% |
| Indians (Asian) | 97.9 /100 | #103 | Exceptional 65.1% |
| Spaniards | 97.8 /100 | #104 | Exceptional 65.1% |
| English | 97.4 /100 | #105 | Exceptional 65.1% |
| Whites/Caucasians | 97.3 /100 | #106 | Exceptional 65.1% |
| Alaska Natives | 97.3 /100 | #107 | Exceptional 65.1% |